Download
1 / 13
130 likes | 238 Views
Development of a Response Index for Corn. Robert Mullen Ohio State University. Response Index. RI first proposed by Johnson and Raun, 2003 (inverse of sufficiency index) RI = Yield of N Rich / Yield of Check (0N) Direct measure of N response. Response Index.

E N D
Development of a Response Index for Corn Robert Mullen Ohio State University
Response Index • RI first proposed by Johnson and Raun, 2003 (inverse of sufficiency index) • RI = Yield of N Rich / Yield of Check (0N) • Direct measure of N response
Response Index • Can we reliably predict the response to applied N during the growing season? • Environmentally and economically important • Less N subject to denitrification, leaching, and runoff • Produce more with less inputs • Is the relationship stable at different stages of growth?
Response Index • In-season estimates of RI were used to identify RI at harvest for winter wheat
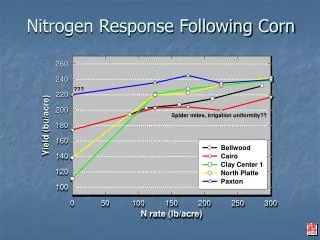
Response Index • Would RI for corn work as well? • Can RI be identified at early stages of growth (< V8)?
Response Index • Varvel et al., 1997 • Used SPAD meters to identify N response at various stages of growth • V6 – R3 • Relationship has been established between GNDVI and SPAD meter reading (Shanahan et al., 2003)
Can RI work for corn? • Varvel data shows that pseudo-RI can be determined at various stages of growth • Very little data for some stages of growth • Lack of response at most locations (especially where corn followed soybeans)
Can RI be estimated at early stages of growth? • Red NDVI determined significant difference between N rate at V4
Can RI be estimated at early stages of growth? • Green and red NDVI determined differences between treatments at V6
Discussion • Practicality of N rich strip • Production scale agriculture without sophisticated sensors • Answer N loss questions and helps make N application decisions
Discussion • The earlier, the better • Determination of RI early in the season would be better • Lack of high-clearance application equipment • Increase in application window
Conclusions? • Continue research to identify relationship between RI-NDVI and RI-Harvest for corn. • “Calibrate” RI at various growth stages with N application rates if yield cannot be predicted accurately (this will be difficult). • Encourage use of N rich strips in production fields to answer simple N application questions.