Download
1 / 15
150 likes | 202 Views
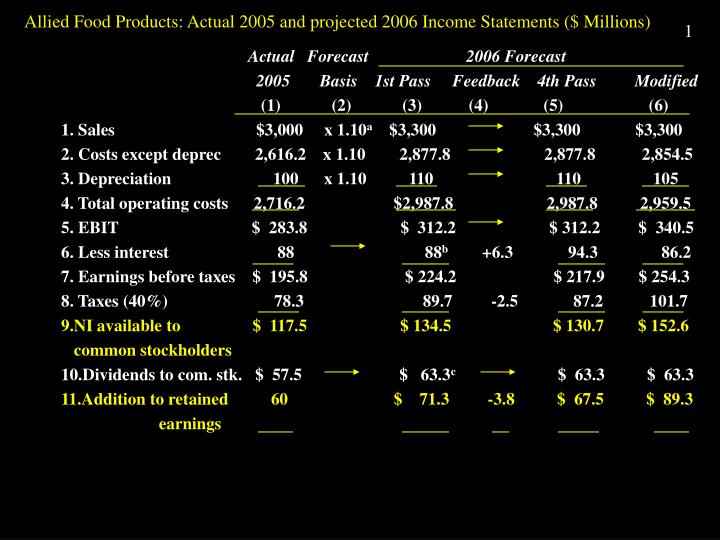
Allied Food Products: Actual 2005 and projected 2006 Income Statements ($ Millions). Actual Forecast 2006 Forecast 2005 Basis 1st Pass Feedback 4th Pass Modified

E N D
Allied Food Products: Actual 2005 and projected 2006 Income Statements ($ Millions) • Actual Forecast 2006 Forecast • 2005 Basis 1st Pass Feedback 4th Pass Modified • (1) (2) (3) (4) (5) (6) • 1. Sales $3,000 x 1.10a $3,300 $3,300 $3,300 • 2. Costs except deprec 2,616.2 x 1.10 2,877.8 2,877.8 2,854.5 • 3. Depreciation 100 x 1.10 110 110 105 • 4. Total operating costs 2,716.2 $2,987.8 2,987.8 2,959.5 • 5. EBIT $ 283.8 $ 312.2 $ 312.2 $ 340.5 • 6. Less interest 88 88b +6.3 94.3 86.2 • 7. Earnings before taxes $ 195.8 $ 224.2 $ 217.9 $ 254.3 • 8. Taxes (40%) 78.3 89.7 -2.5 87.2 101.7 • 9.NI available to $ 117.5 $ 134.5 $ 130.7 $ 152.6 • common stockholders • 10.Dividends to com. stk. $ 57.5 $ 63.3c $ 63.3 $ 63.3 • 11.Addition to retained 60 $ 71.3 -3.8 $ 67.5 $ 89.3 • earnings
Allied Food Products: Actual 2005 and projected 2006 Income Statements ($ Millions) • a x 1.10 indicates “times 1 + g”; used for items which grow proportionally with sales. Here g = 0.10. • b 2005 amount carried over for first-pass forecast. Indicated in Column 2 by an arrow. • c Projected figure. See text for explanation.
Allied Food Products: Actual 2005 and projected 2006 Balance Sheets • 2006 Forecast • Actual‘05 1+ Sales g 1st Pass AFNa 4th Pass • (1) (2) (3) (4) (5) • Cash $ 10 x 1.10b $ 11 $ 11 • Accounts receivable 375 x 1.10 412.5 412.5 • Inventories 615 x 1.10 676.5 676.5 • Total current assets $1,000 $1,100 $1,100 • Net plant & equipment 1,000 x 1.10 1,100 1,100 • Total assets $2,000 $2,200 $2,200 • Accounts payable $ 60 x 1.10 $ 66 $ 66 • Notes payable 110 110c +7.9 117.9 • Accruals 140 x 1.10 154 154 • Total current liabilities $ 310 $ 330 $ 337.9 • Long-term bonds 750 750 +51.7 801.7 • Total debt $1,060 $1,080 $1,139.6 • Common stock 130 130c +52.9 182.9 • Retained earnings 810 +71.3d 881.3 877.5 • Total common equity $ 940 $1,011.3 $1,060.4 • Total liabilities & equity $2,000 $2,091.3 +108.7 $2,200 • Add’l funds needed (AFN) $ 108.7 • Cumulative AFN $ 108.7
Allied Food Products: Acutal 2005 and projected 2006 Balance Sheets ($ Millions) • a AFN stands for “Additional Funds Needed.” This figure is determined at the bottom of Column 3 and Column 4 shows how the required $108.7 of AFN will be raised. • b x 1.10 indicates “times 1 + g”; used for items which grow proportionally with sales. Here g = 0.10 • c Indicates a 2005 amount carried over as the first-pass forecast. Arrows also indicate items whose values are carried over from one pass to another. • d From Table 17-1, Line 13
The AFN Formula • Additional Required Spontaneous Increase in • funds = increase - increase in - retained • needed in assets liabilities earnings • AFN = (A*/S) S - (L*/S) S - MS1(1 - d) • Descriptions of notations on following slides.
The AFN Formula • AFN = additional funds needed. • A*/S = assets that must increase if sales are to to increase expressed as a percentage of sales, or the required dollar increase in assets per $1 increase in sales. A*/S = $2,000/$3,000 = 0.6667 for Allied. Thus, for every $1 increase in sales, assets must increase by about 67 cents. Note that A designates total assets and A* designates those assets that must increase if sales are to increase. When the firm is operating at full capacity, as is the case here, A* = A. Often, though, A* and A are not equal, and the equation must be modified or else the projected financial statement method must be used.
The AFN Formula • L*/S = liabilities that increase spontaneously with sales as a percentage of sales, or spontaneously generated financing per $1 increase in sales. L*/S = ($60 + $140) / $3,000 = 0.0667 for Allied. Thus, every $1 increase in sales generates about 7 cents of spontaneous financing. Again, L* represents liabilities that increase spontaneously, and L* is normally much less than total liabilities (L). • S1 = total sales projected for next year. Note that S0 designates last year’s sales. S1 = $3,300 million for Allied.
The AFN Formula • S = change in sales = S1 - S0 = $3,300 million - $3,000 million = $300 million for Allied. • M = profit margin, or rate of profit per $1 of sales. M = $114/$3,000 = 0.0380 for Allied. • d = percentage of earnings paid out in common dividends, or the dividend payout ratio; d= $58/$114 = 0.5088 for Allied.
Financial Forecasting • Latest Financial • Financial Sales Cost Accounting Market • Statements Forecast Forecasts Data • Preliminary Projections: • 1. Financial Statements • 2. Financing Plan • Modify 3. Resulting Ratios • and • Revise Evaluation: • Is the preliminary plan a good one, or • Bad Plan should it be modified? • Good Plan • Final Projections: • 1. Financial Statements • 2. Financing Plan • 3. Resulting Ratios
Relationship between Growth in Sales and Capital Requirements • Additional Required Spontaneous Increase • funds = increase increase in in retained • needed in assets liabilities earnings • AFN= ( A ) S -( L ) S-MS1(1-d) • SS • Example : S = $2,000: MS1 (1-d) = $900 • AFV = (1.4) ($2,000) - (0.20) ($2,000) - $900 • = $2,800 - $400 - $900 • = $1,500
Cooley TextilesPro Forma Income StatementDecember 31, 2006(Thousands of Dollars)
Cooley TextilesPro Forma Balance Sheet (Asset side)December 31, 2006(Thousands of Dollars)
Cooley TextilesPro Forma Balance Sheet Continued December 31, 2006(Thousands of Dollars)
AFN = (A/S0)S - (L/S0)S - MS1 (1-d) • 29,160 4320+2880 • AFN = ---------- x (5400) - --------------- x (5400) - 1138.5 • 36,000 36,000 • AFN = 0.81 (5400) - .20 (5400) - 1138.5 • AFN = 4374 - 1080 - 1138.5 • AFN = 3294 - 1138.5 • AFN = 2155.5
Cooley TextilesPro Forma Income StatementDecember 31, 2006(Thousands of Dollars) • 1,800 • M = Profit Margin = ------------- = 5% • 36,000 • S1 = 41,400 810 • d = Dividend Payout Ratio = -------- = 45% • 1,800 • M S1 = 5% (41,400) = 2,070 = Net Income • Addition to RE = M S1 (1-d) = 1138.5 • S = 41,400 - 36,000 = 5,400