Download
1 / 21
210 likes | 340 Views
The Daya Bay Reactor Neutrino Experiment. R. D. McKeown Caltech. On Behalf of the Daya Bay Collaboration. CIPANP 2009. Maki – Nakagawa – Sakata Matrix. Gateway to CP Violation!. CP violation. n e Survival Probability. Dominant 12 Oscillation. Subdominant 13 Oscillation.

E N D
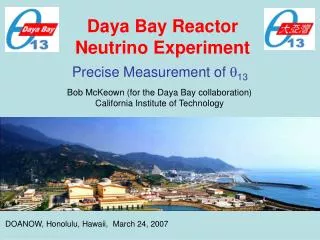
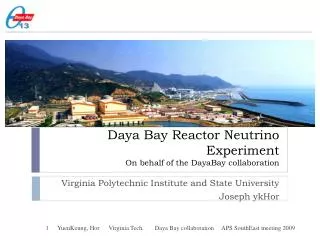
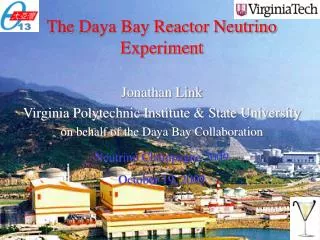
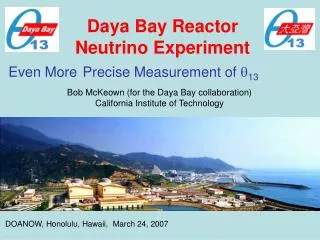
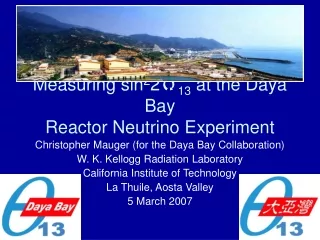
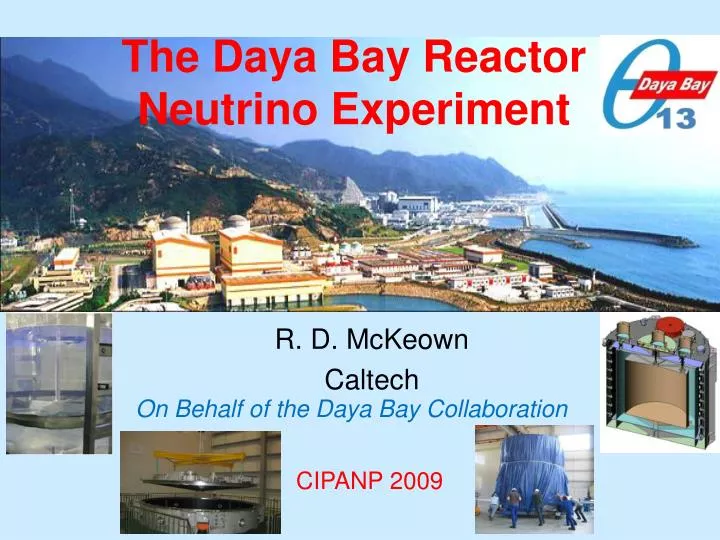
The Daya Bay Reactor Neutrino Experiment R. D. McKeown Caltech On Behalf of the Daya Bay Collaboration CIPANP 2009
Maki – Nakagawa – Sakata Matrix Gateway to CP Violation! CP violation
ne Survival Probability Dominant 12Oscillation Subdominant 13 Oscillation • “Clean” measurements of q, Dm2 • No CP violation • Negligible matter effects
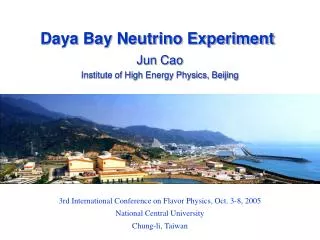
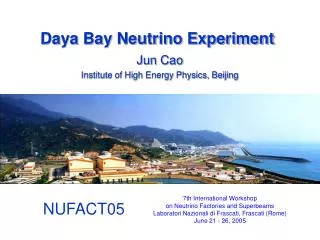
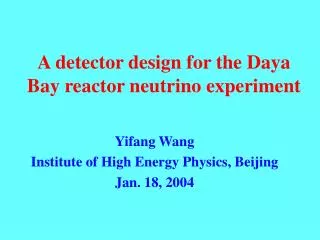
Daya Bay Nuclear Power Plant • 4 reactor cores, 11.6 GW • 2 more cores in 2011, 5.8 GW • Mountains provide overburden to shield cosmic-ray backgrounds • Baseline ~2km • Multiple detectors → measure ratio
Daya Bay NPP Location 55 km
Experiment Layout • Multiple detectors • per site cross-check • detector efficiency • Two near sites • sample flux from • reactor groups 20T Total Tunnel length ~ 3000 m
Antineutrino Detector Calibration units ne +p → e+ + n n capture on Gd (30 ms delay) 192 8” PMT’s 20 T Gd-doped liquid scintillator Gamma catcher Buffer oil • 3 zone design • Uniform response • No position cut • 12%/√ E resolution Acrylic Vessels SS Tank
Muon Veto System RPC’s Water Cerenkov (2 layers) Redundant veto system → 99.5% efficient muon rejection
Gd-LS stability in prototype Absorption time (days) Gd-Liquid Scintillator Test Production Daya Bay experiment uses 200 ton 0.1% gadolinium-loaded liquid scintillator (Gd-LS). Gd-TMHA + LAB + 3g/L PPO + 15mg/L bis-MSB 500L fluor-LAB Two 1000L 0.5% Gd-LAB 5000L 0.1% Gd-LS 0.1% Gd-LS in 5000L tank 4-ton test batch production in April 2009. Gd-LS will be produced in multiple batches but mixed in reservoir on-site, to ensure identical detectors. Production Steps 1. Produce Gd solid2. Dissolve the Gd solid in LAB and get 0.5% Gd-LAB3. Dissolve fluors in 500L LAB4. Mix 1000L 0.5% Gd-LAB, 500L fluors-LAB, and LAB, to form 0.1% Gd-LS Daya Bay: production of 185 ton of 0.1 Gd-LS, 4-ton per batch test batch: production of 3.7 ton 0.1% Gd-LS
Controlling Systematic Uncertainties Measured Ratio of Rates Proton Number Ratio Detector Efficiency Ratio sin22q13 0.3% Storage Tank + flow & mass measurement 0.2% Near Far Calibration systems
Target Mass Measurement ISO Gd-LS weighing tank filling platform with clean room pump stations 20-ton, teflon-lined ISO tank Gd-LS MO LS detector Coriolis mass flowmeters < 0.1% load cell accuracy < 0.02%
Efficiency & Energy Calibrations 1 MeV 8 MeV 6 MeV 10 MeV Prompt Energy Signal Delayed Energy Signal • Stopped positron signal using 68Ge source (2 x 0.511 MeV) • e+ threshold • Neutron (n source, spallation) capture signal • 2.2 MeV e+ energy scale • 8 MeV neutron threshold at 6 MeV
Calibration Program Automated calibration system • Routine (weekly) deployment of sources. • LED light sources • Radioactive sources = fixed energy • Tagged cosmogenic background (free) = fixed energy and time (electronics requirement) Monitoring system for optical properties e+ and neutron sources for energy calibration s/E = 0.5% per pixel Requires: 1 day (near) 10 days (far)
4 near detectors Rates and Backgrounds 9Li n signal
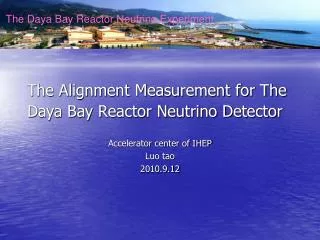
Site Preparation Daya Bay Near Hall construction (100m underground) Assembly Building Tunnel lining Portal of Tunnel
Hardware Progress SSV Prototype 4m Acrylic Vessel Prototype Transporter Calibration Units
Detector Assembly Delivery of 4m AV SS Tank delivery Clean Room
Sensitivity to Sin22q13 90% CL, 3 years • Experiment construction: 2008-2011 • Start acquiring data: 2011 • 3 years running
Project Schedule • October 2007: Ground breaking • August 2008: CD3 review (DOE start of construction) • March 2009:Surface Assembly Building occupancy • Summer 2009: Daya Bay Near Hall occupancy • Fall 2009: First AD complete • Summer 2010: Daya Bay Near Hall ready for data • Summer 2011: Far Hall ready for data (3 years of data taking to reach goal sensitivity)