Download
1 / 86
860 likes | 972 Views
Share Investments 1 Subtopic 6.1 - Investing in the Securities Market. 1 Test 1 Project. Overview of Unit. Purpose of the market Reasons for investment Buying / selling shares – various methods Calculating breakeven point Moving Averages, price-earning ratio Yield Dividends

E N D
Share Investments 1Subtopic 6.1 - Investing in the Securities Market 1 Test 1 Project
Overview of Unit • Purpose of the market • Reasons for investment • Buying / selling shares – various methods • Calculating breakeven point • Moving Averages, price-earning ratio • Yield • Dividends • Rights or bonus issues and the effect on share price • Taxation – Capital Gains / Dividend Imputation • Index Numbers – All Ordinaries, sector indices • Construction and calculation of share index • Inflation • Comparison of indices to gauge performance
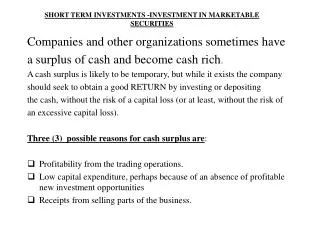
The Purpose of the Share Market • Primary Market • Raises capital for a company: • Issue a prospectus via an underwriting broker. • Investors subscribe for shares • A company may want to raise 5 million – so they float 20 million shares @ 25cents each. • Investors can remain as shareholders of the company or sell the shares on the Secondary Market.
Secondary Market: • Is where issued shares can be traded via a stockbroker. • It operates like an auction using the ASX’s computer trading system called SEATS (Stock Exchange Automated Trading System). • When a sell bid matches a buy bid a trade is executed. The value of the share is influenced by demand, overseas economics, interest rates, company news….
Stockbroker • Any transaction at the stock exchange needs to be carried out by a broker. • They are members of the ASX and need to meet certain criteria to become a broker. • They buy and sell shares for their clients and charge a fee. • They can also : • Give advice • Act as an underwriter for new share issues
Listed Companies • Not any public company can be listed on the exchange. • They need to be of sufficient size. • They need to meet a number of regulations : • Have at least 500 share holders • Have Capital of $1 million dollars • Release half yearly financial reports • Be run by a board of directors who decide on business strategy and such things as dividends etc.
Advantages of a public company listing • Funds are raised relatively easily • Investors are attracted to a well performing company • Key staff can be retained by offering share incentives • Disadvantages of public company listing • Existing ownership is diluted • Directors are accountable to shareholders • ASX requires important information to be disclosed to the market. • Increased costs – listing fees, broker fees ..
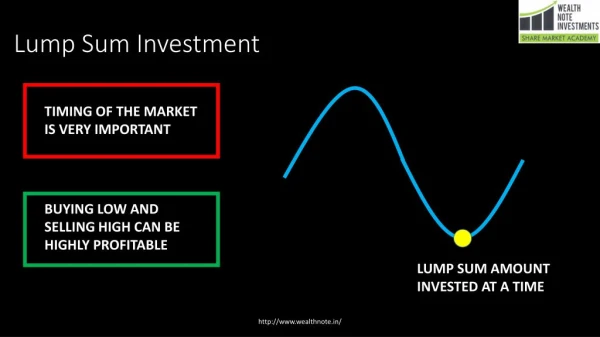
Trading on the Sharemarket • Can bring good returns – Capital Gain • Can bring regular income – Dividends • A balanced portfolio can bring a regular income as well as a steady capital gain • Diversified investments can help offset any major losses • Long term investment is generally better than short term
What Shares? • Deciding on what shares to purchase can be daunting. • A newspaper share list gives a lot of information.
Year High / Low Stock Close / Move Buy / Sell Volume Sales High / Low Yield
What Shares? • Media releases • Stock Brokers / Financial Planner • Newspaper – financial pages / share lists • Types of shares • Prospectus • Website - research • Yield • Company History • Formulas • Annual Reports • Company performance charts • Volumes of shares traded • High / Lows • Blue Chip • Seasonal Shares • Long Term / Short Term Investments • Business Operations • Amount of money available
When to trade? • After bonus / rights issues – share price drops • Graphs • Breakeven Price • Averages • Pre dividend / post dividend • General market trends – crash – risk • “Trade only money that you are willing to lose” • Ethical trading
Ordinary Shares • Ordinary shares are the most common types of shares. • When a company is floated – the majority of the share capital is made up of ordinary shares. • They are cheap (50c each) • Deliver dividends • Potential for capital gain • Dividends are paid after preference shares are paid out. • Have voting rights. • Most investors opt for a portfolio that has a majority of ordinary shares.
Preference Shares • Preference shares are not as common as ordinary shares. • When a company is floated there is normally a percentage of the shares that are preference shares. • They are more expensive than ordinary shares. • Deliver dividends at a fixed rate. • Potential for capital gain. • Dividends are paid before ordinary shares. • Have limited voting rights. • Some investors will have some preference shares to ensure a regular predictable dividend payment.
Rights Issues • If a company wishes to raise more capital once a float has taken place the only option they have is to release a rights issue. • This is where shares are offered at a discount to existing shareholders. • BONUS ISSUES are similar to rights issues but they are free. • .
Terminology • When the type of shares is written down – it normally takes the form of : 500,000, $2, 5% preference shares Number of shares Dividend rate Par Value 500,000, 50c, Ordinary shares Number of shares Par Value
Buying • When you purchase shares you need to calculate how much it will cost you to buy the shares. • You need to take into account the cost of the shares, brokerage and GST. • Some brokers charge a fixed fee – internet transactions tend to do this. • Most charge a % of the price of the shares. • Make sure you do all the steps.
Example • Calculate how much it would cost to purchase 5500 AMP shares at $3.20 each. Brokerage is 2% and a GST of 10% is applied to brokerage.
Consideration : 5500 x 3.20 = 17600 Brokerage : 2% x 17600 = 352.00 GST : 10% x 352 = 35.20 Total : (17600 + 352 + 35.20) $17987.20
Selling • When you sell shares the only difference from buying is that you take away the fees charged. Consideration – Brokerage - GST
Example • Calculate how much you would receive if you sold 7500 AMP shares at $4.20 each. Brokerage is 2.5% and a GST of 10% is applied to brokerage.
Consideration : 7500 x 4.20 = 31500.00 Brokerage : 2.5% x 31500 = 787.50 GST : 10% x 787.50= 78.75 Total : (31500 – 787.50 – 78.75) $30633.75
When you buy and sell shares to make a profit it is wise to calculate the minimum price they have to rise to so that you cover your costs. • This is not a calculation that allows you to make huge profits – but the price that you need to sell them at so as not to make a loss.
Procedure • Step 1 – First buy the shares. • Step 2 – Add on the fees involved in buying again. • Step 3 – Divide this by the number of shares purchased – this is the selling price needed to cover your costs (round up if needed). • Step 4 - Sell the shares at this new price • Step 5 – Check to see if you breakeven (if not just add 1c)
You buy 3400 KMB shares for $8.77 – calculate the breakeven price. (2% brokerage 10% GST) Step 1 – First buy the shares. Consideration : 3400 x 8.77 = 29818 Brokerage : 2% x 29818 = 596.36 GST : 10% x 596.36 = 59.64 Total : (29848 + 596.36 + 59.64) $30474.00 So when we sell them we need to get at least $30474.00
Step 2 – Add on the fees involved in buying again. Total = 30474.00 Brokerage = 596.36 GST = 59.64 31130.00
Step 3 – Divide this by the number of shares purchased – this is the selling price needed to cover your costs (round up if needed). Total (from 2) 31130 / 3400 = 9.1559 Number of shares So the new price should be $9.16 – but we need to check by selling the shares at this price (if in doubt round up!)
Step 4 - Sell the shares at this new price Consideration : 3400 x 9.16 = 31144 Brokerage : 2% x 31144 = 622.88 GST : 10% x 622.88= 62.29 Total : (31144 – 622.88 – 62.29) $30458.83 Step 5 – Check to see if you breakeven (if not just add 1c) We bought them for 30474.00 and sold them for 30458.83 – so we have NOT covered our costs – if we add 1 cent to the selling price we raise another $34 - (3400 x 0.01 = $34) – and if we add that onto 30458.83 we break even with about $15.17 spare – so our BEP will be $9.17
Other Indicators When to buy and sell
Yield • It is hard to compare the prices of shares to see if your investment has been or is a good one. • You really need to take into account the cost of purchasing the shares and the annual income.
This type of question means that you need to calculate the cost of buying AND the income you will get in the form of a dividend. • There s a shorter method – that does not take into account the fees that you pay when you buy shares. (less accurate)
Price Earnings Ratio The price earnings ratio shows the number of times the share price covers the earnings per share. Eg if a P/E ratio is 14 for BHP shares this indicates that it will take 14 years for the earnings to cover the share price. Assuming the price and returns remain constant. • This ratio is commonly used to ascertain a stock’s relative value, and therefore whether it is over priced. Calculation of Price Earning Ratio • It is calculated daily by dividing the share price by the earnings per share, where earnings per share is the net profit, earned by the company, divided by the number of ordinary shares on issue for the company.
The P/E ratio is calculated daily and can be listed in share tables and is calculated by dividing the market value of the company by it’s earning per share. The earnings per share are calculated by getting the previous year’s net profit for ordinary shareholders and dividing this by the number of ordinary shares. High P/E ratio may indicate that investors are expecting high growth in earnings in the future. You can really only compare companies from the same industry sector. If the industry is stable then the P/E ratio may be low – like banks. But if there is speculation and a lot of movement then the P/E ratio may be high.
Market conditions will have a strong influence on relative P.E ratios – it does give a snap shot regarding the economic growth of the company.
Company Charts • Companies will produce charts that show you how the shares are performing. • There are a variety of charts that can help give insight into what is going onallowing you to make better informed decisions regarding trading. • As with all decisions, the broader the information you have the “better” the decision can be.
Candlestick Charts These charts give you a lot more information than just a graph that uses the closing price. It shows the opening price, high, low and closing price. The rectangle body shows the open and close price. If it is green it means that the shares closed higher, if red lower. If clear then it hasn’t moved. So this shows you a quick snapshot of the shares. The whiskers or wicks show the highest and lowest price they traded at.
Moving Average This is a widely used indicator that can assist in determining the direction of a trend. When used in conjunction with other indicators it can generate buy and sell signals to the investor. This indicator is used by many people in their final determination of whether to trade. They would only act if the moving average is trending in the direction of the signal or if the price is on the same side of the moving average as the signal is indicating. The moving average has a smoothing effect and can be used to remove noise from the market, by reducing a basic open/high/low/close bar graph a simple line graph. The simple moving average uses the close price to calculate its value over a given time. Depending on the nature of the trader different time frames will be used to determine the length of the moving average.