Download
1 / 27
270 likes | 456 Views
The Consulate General of the Republic of Indonesia Hong Kong. Indonesia Today: Economic, Trade and Tourism. Basic Fact. Area (km 2 ): Land : 1,826,440 Water : 93,000 Total : 1,919,440 17,000 islands Population: 230 million

E N D
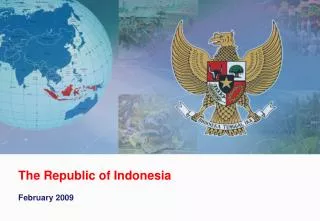
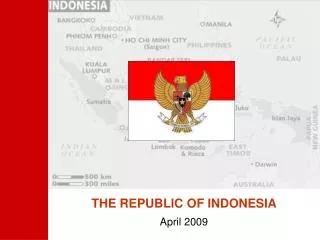
The Consulate General of the Republic of Indonesia Hong Kong Indonesia Today: Economic, Trade and Tourism
Basic Fact • Area (km2): • Land : 1,826,440 • Water : 93,000 • Total : 1,919,440 • 17,000 islands • Population: 230 million • 316 ethnic group : Javanese 40.6%, Sundanese 15%, Madurese 3.3%, Minangkabau 2.7%, Betawi 2.4%, Bugis 2.4% • Muslim 86.1%, Protestant 5.7%, Roman Catholic 3%, Hindu 1.8%, other or unspecified 3.4% • Employment (Feb 2007): • Labour Force :108 131 058 • Working : 97 583 141 • Unemployment : 10 547 917 (9.75%) Source: Bank Indonesia and CLSA
Economic Indicators • GDP (Q2-2007) • Constant 2000 prices by sector Rp 486,483.30 billion (HK$ 419.38 million) • Current prices by sector Rp 962,501.70 (HK$ 829.74 million) • GDP growth: 6.0% • Per capita GDP US$ 1,176 • GNP (Q2-2007) : Rp 933,208.70 billion (HK$ 804.4 million) • BoP : US$ 4,415 million • Foreign Currency Reserves (31 Oct.2007) : US$ 51,900.98 million Source: Bank Indonesia
Foreign Trade Value • Export value (Jan-Sept 2007) : US$ 83.02 billion (yoy 12.88%) • Export (Sept. 2007): US$ 9.52 billion (yoy +7.63%) • Non-oil &gas export (Jan-Sept. 2007): US$ 67.65 billion • Non-oil & gas export (Sept. 2007): US$ 7.54 billion (the biggest export is nickel: US$ 65.5 million) • Main destinations (non-oil & gas): Sept. 2007 - Japan : US$ 1.06 billion - US : US$ 1.03 billion - Singapore : US$ 903.2 million - EU ( 25 countries ) : US$ 933.6 million Source: Statistics Indonesia (BPS)
Foreign Trade Value (cont’d) • Import Value (Jan-Sept.2007):US$ 53.67 billion (yoy 17.43%) • Import (Sept. 2007) : US$ 6.76 billion • Non- oil & gas import (Jan-Sept. 2007) : US$ 38.51 billion • Non- oil & gas import (Sept. 2007) : US$ 4.52 billion • Oil & gas import (Jan-Sept 2007): US$ 15.17 billion • Biggest import value: machineries/mechanical engineering: US$ 6.73 billion (17.47% of total import) • Biggest Exporters (CoO): - China : US$ 5.84 billion (15.17% of total import) - Japan : US$ 4,67 billion (12.12% of total import) - US : US$ 3.41billion (8.85% of total import) Source: Statistics Indonesia (BPS)
Bilateral Trade Hong Kong – Indonesia • Total Trade (in US$ million): 3,179.9 (2005); 3,341.9 (2006); 1,825.8 (2007*) • HK export to Indonesia: 1,261.3 (2005); 1,424.0 (2006); 796.9 (2007*) • HK import from Indonesia 1,918.6 (2005); 1,917.9 (2006); 1,029.0 (2007*) • Indonesia: main importers for Hong Kong (rank 16th) * Jan-Jun 2007
Bilateral Trade Hong Kong – Indonesia Highlight of Main Import Commodities from Indonesia (in US$ million): • Coal : 436.3 (2005); 415.1 (2006); 273.9 (2007*) • Textile Yarn & clothings: 139,9 (2005); 123.3(2006); 60.5 (2007*) • Paper & paper board: 113.1 (2005); 89.7 (2006); 34.0 (2007*) • Fish, crustacean, mollusk & others: 98.8 (2005); 100.3 (2006); 70.1 (2007*) * Jan-Jun 2007
Multi-Track Strategy in Trade Negotiations • Multilateral: World Trade Organization, Doha Agenda • Regional: • ASEAN Economic Community: goods, services (partial), investment (partial), mutual recognition agreements, customs procedures and ASEAN Single Window by 2008 • ASEAN-China Free Trade Agreement (ACFTA): goods, and beginning in services • ASEAN-Korea FTA (AKFTA): goods • ASEAN-India FTA, Japan, and ASEAN-Australia New Zealand FTA (AANZFTA) (still in negotiations) • Bilateral: • Indonesia and China Strategic Partnership: enhancing cooperation in investment, agriculture, forestry, fishery, manufacture, technology, energy, infrastructure, and capacity building. Target for bilateral trade: US$ 20 billion (2008), US$ 30 billion (2010) • Indonesia-Japan Economic Partnership Agreement (IJEPA)—agreement in principle on major elements
New initiatives in strengthening Indonesia’s competiveness • To develop diverse products in response to market demand and to exploit market opportunities • A timely respond to the changing demand for components • Continue to improve logistics • Adopt a cost effective method to control the process of flow and storage of materials, finished goods, services, in response to changing environmental conditions • To improve information technology system to adapt and support changing requirements of the business environment
Strengthened comparative advantage • Indonesia has strategic location, at the cross-road of one of the heavy traffic sea lane allows it to specialise in a segment of the production chain to cement its place and china for the global supply chain • specialisation especially in labour intensive stages of production • Strengthened comparative advantage ensures sustainable and expanding export industries • Ready to move from the specialisation in the existing segment of the production chain to a higher value added segment of the production chain
Concentrate in more improved Indonesian infrastructure • Just-in-time production networks necessitates improving the efficiency of production supporting infrastructure • Transport and telecommunications infrastructure • Demand driven infrastructure development • Provides opportunities for Indonesia supplying the global supply chain • develop a segment of the production network to feed into the region production network and then global supply chain • Benefit from globalisation, climbing the technology ladder and gain wider access to international markets • A more integrated and closer to the region (EA/ASEAN) • Production sharing means Indonesia becoming more interdependent on each other with countries in the region • to more market oriented policies • Renders protectionist, import substitution and anti-foreign investment policies less effective
Foreign Direct Investment (per August 2007) • Investment Realization (Jan-Aug.2007) • Total of Issued Permanent Licenses : 697 US$ 8.138,6 million • Manpower Absorption : 130.725 persons • Investment Value by Location (Provinces): • Jakarta Capital Territory = US$. 4,294.9 million (244 projects) • East Java = US$. 1,654.2 million (52 projects) • West Java = US$. 824.1 million (177 projects) • Riau = US$. 412.7 million (6 projects) • Banten = US$. 169.8 million (50 projects) Note: Excluding of investment in Oil and Gas, Banking, Non Bank Financial Institution, Insurance, Leasing, Mining in Terms of Contracts of Work, Coal Mining in Terms of Agreement of Work, investment which licenses issued by technical/sectoral agency, Porto folio as well as household investment.
Foreign Direct Investment 10 Leading FDI in Indonesia 1 January 1967 –31 December 2006 (Approved Projects) • No. Country Projects Value (US$ Billion) • 1. Japan 1,750 39.42 • 2.UK1,016 35.19 • 3. Singapore 2,315 28.43 • 4. Hong Kong 549 20.90 • 5. Taiwan 1,163 13.47 • 6. Malaysia 1,175 12.54 • 7. South Korea 2,726 12.14 • 8. USA 680 11.79 • 9. Germany 356 95.21 • 10. Australia 717 95.17
Foreign Direct Investment (cont’d) • Investment Value by Country/Area: • Singapore = US$. 3,177.6 million (78 projects) • United Kingdom = US$. 1,597.1 billion (51 projects) • Japan = US$. 500.4 million (82 projects) • Taiwan = US$. 465.3 million (25 projects) • South Korea = US$. 238.0 million (125 projects) • Realized Investment Value by Sectors: • Transport, Storage & Communication = US$. 3,289.4 million (30 projects) • Chemical and Pharmaceutical Industry = US$. 1,563.5 million (25 projects) • Food Industry = US$. 492.5 million (41 projects) • Paper and Printing Industry = US$. 428.5 million (10 projects) • Trade & Repair = US$. 346.4 billion (207 projects) Source: Indonesian Investment Coordinating Board (BKPM)
Foreign Direct Investment (cont’d) Hong Kong SAR • Realization of FDI Value from Hong Kong (Jan- Aug 2007) : US$ 105.8 million (9 projects) • FDI Planning Approvals Value (Jan- Aug 2007) : US$ 239.2 million (22 projects) People’s Republic of China • Realization of FDI Value from Hong Kong (Jan- Aug 2007) : US$ 18.7 million (14 projects) • FDI Planning Approvals Value (Jan- Aug 2007) : US$ 207.4 million (75 projects)
Trend of FDI Investment from HK:trend investasi berdasar negara.xls Total Projects Investment (in US$ million) FDIs from Hong Kong
A strategic approach to boost Investment • Improvement in Investment Climates • Reform both regulatory and institutional in general investment climates and infrastructure development. • On February 16, 2006, launched Infrastructure Policy Package • On March 3, 2006, launched Investment Policy Package • Address corruption and high costs of doing business • Infrastructure Indonesia 2005 – 2006 • Indonesian government held Infrastructure summit twice: the 1st summit was held on 17 – 18 January, 2005 and the 2nd on 1- 3 November 2006. • Indonesia infrastructure Summit and Exhibition dedicated to advancing Indonesia’s infrastructure development projects. • Improving access to financing and cost of financing • On July 5, 2006, launched Financial Sector Policy Package aims at improving coordination between the Government and the central bank, Bank Indonesia, and steps to strengthen the banking industry, non-bank financial institutions and the capital market.
New Investment Law: Just approved by the Parliament in March 2007 • More conducive environment for investment in Indonesia • Equal treatment between foreign and domestic investors • Clear definition of sectors closed/open with condition • Procedures for investment approvals will be streamlined • Protection from nationalization and expropriation • Incentives will be given to new investors for selected sectors (e.g. Pioneer sectors) and regions: Fiscal, Immigration, Access to land etc. • Improvements in trade facilitation measures • National and ASEAN Single Window (one stop service for processing of import and export documents/procedures) • Batam Pilot, 2007 Tanjung Priok • 25 government agencies (collection of documents, standardization) • Transparency of standards
Policy and institutional reforms for creating legal certainty, consistency and reduce the costs of doing business • Covers • General Investment Law and Regulations • Taxation • Customs • SME • Short term measures on deregulation and reducing red tape, and ongoing anti corruption drive
Special FREE TRADE Zones: The Parliament promulgated new law to select three islands e.i. Batam, Bintan and Karimun, near to Singapore as “Free Trade Zone”. The New Law is focusing on creating ‘islands of excellence’ because it is easier to remove supply-side constraints from small geographical areas than the whole economy. Being immediate neighbor to Singapore, these FTZ have strategic advantage. Efficient regulation and licensing will be a crucial part of these new special economic zones. Each zone will have a single zone authority which will provide best practices in terms of services to investors. In particular streamlining necessary licenses and permits from the central and local governments to operate in the zones, services to resolve problems and supporting administrative services in various areas such as customs, import and export procedures. The Government is currently working on a set criteria to support those areas which already like infrastructure, supporting industries, access to inputs of production including skilled labor.
Tourism • Top Ten Visitors to Indonesia by Country/Region of Residence (2006) • Singapore : 1,401,804 • Malaysia : 769,988 • Japan : 419,213 • Australia : 226,981 • Taiwan : 236,384 • UK : 110,412 • USA : 130,963 • Germany : 106,629 • Netherland : 110,272 • PRC : 147,245 • Visitors from Hong Kong SAR (2006) : 78,386 (rank 13)
Support to ASEAN Economic Community • Continue to pursue ASEAN’s vision as a single market and production base by 2015 • Strengthens ASEAN’s position in the global supply chain • Deepens specialisation and improves the efficiency of ASEAN’s production base • Support ASEAN as a single market and production base • Integration for 11 priority sectors • Argo-based products, air travel, automotive products, e-ASEAN, electronics, fisheries, health care, rubber-based products, textiles and apparels, tourism and wood-based products • Cost competitive products represent around 50 per cent of intra-ASEAN trade • ASEAN Investment Area • ASEAN Industrial Cooperation Scheme • ASEAN Single Window
Useful Website • Indonesian National Portal: www.indonesia.go.id • Ministry of Foreign Affairs: www.deplu.go.id • Ministry of Trade: www.depdag.go.id • Taxation: www.pajak.go.id • Investment Coordinating Board: www.bkpm.go.id • Indonesian Tourism Promotion : http://www.my-indonesia.info/