Download
1 / 67
670 likes | 848 Views
Diane Ebert-May, Kathy Williams, George Middendorf Michigan State University San Diego State University Howard University www.first2.org. Innovative Teaching to Achieve Active Learning in Ecology. HHMI. Our Team at MSU. Doug Luckie - Physiology

E N D
Diane Ebert-May, Kathy Williams, George Middendorf Michigan State University San Diego State University Howard University www.first2.org Innovative Teaching to Achieve Active Learning in Ecology HHMI
Our Team at MSU • Doug Luckie - Physiology • Janet Batzli - Plant Biology (University of Wisconsin) • Scott Harrison - Microbiology • Tammy Long - Ecology • Heejun Lim - Chemistry Education • Joyce Parker - Biochemistry • Duncan Sibley - Geology
“Consensogram” Directions 1. Take one color-coded post-it for each question, write the question # in the corner. 2. Write a number between 0-100 on each post-it in increments of 10. 3. Do not share responses
“Consensogram” Questions Please respond on a scale of 0 -100 in increments of 10: • What proportion of your undergraduate courses were based on active, inquiry-based learning? • To what degree should undergraduate courses be based on active, inquiry-based learning? • To what degree do the assessments you use (or you experienced as an undergraduate) provide convincing data about student learning? • How important is it to use multiple kinds of data to assess your students? • How often do I use data to make instructional decisions? • In my department, teaching is as important as research and is rewarded accordingly. (100 agree - 0 disagree)
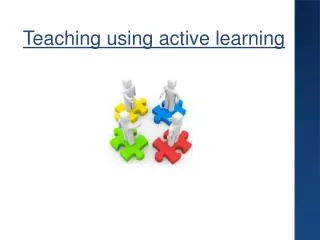
Goals for This Workshop As a result of your participation in this workshop, you will... • Develop a practical and theoretical understanding about active and inquiry-based learning. • Use multiple instructional designs and strategies that promote active learning by all students. • Analyze multiple forms of assessment to gather data about students’ understanding. • Use data to identify student misconceptions and subsequently improve instructional design. • Consider the scholarship of teaching and learningin terms of research, recognition, and rewards.
Cooperative Groups • 4 students per group • Person A, B, C, D in each group • First - read problem/think about task individually • Discuss: A with B • C with D • Form group consensus
Grape Problem • Engagement activity: insight into prior knowledge, experience and current thinking of students. • Goal: model inquiry, active learning.
How did this inquiry “work?” • Develop a learning goal for this inquiry. • List the performance expectations for your students. • Written response. Overhead. • Reporter - Person C • Recorder - Person D • Timekeeper - Person A (3 minutes) • Checker - Person B
True or False? • Faculty are interested in assessing their students’ learning better, but just don’t know how to?
True or False? • Lack of meaningful assessment in undergraduate education occurs because faculty are satisfied to be less accountable in their teaching than they are in their research.
True or False? • Assessing student learning in science parallels what scientists actually do as researchers.
Assessment in ‘Teaching’Parallels Assessment in ‘Research’ • Questions we ask are meaningful, interesting, fundable. • Questions are based on current knowledge and theories. • Data we collect are aligned with questions or hypotheses. • Research designs appropriate for question and accepted in the field. • Instruments/techniques we use are calibrated, valid, repeatable. • We explain results in the context of our questions. • Results drive our next questions. • Our ideas are peer reviewed for publication/funding.
Assessment of Learning • Curriculum development & assessment of learning are inseparable, so integrate. • Assessment knowledge? No… • Curriculum knowledge? Yes… • Use statistician in science …who is comparable person in education?
What are 3 central questions about learning? 1. What do we want our students to know and be able to do? 1.5. What evidence will we accept that students know and can do? 2. How does our teaching help learning?
Cognitive Theory • “Learners are not simply passive recipients of information; they actively construct their own understanding.” • Svinicki 1991
Ultimate goal of teaching: 1. Improved student learning. 2. Improved student learning. 3. Improved student learning.
What Type of Learning? • Bloom (1956) • Major categories in the Cognitive Domain of Educational Objectives
Convergent Thinking • Knowledge - remember material • Comprehension - grasp the meaning of material • Application - use learned material in new concrete situations • Adapted from Grolund (1970)
Divergent Thinking • Analysis - break down material to understand organizational structure • Synthesis - put parts together to form a new whole • Evaluation - judge value of material for a purpose • Adapted from Grolund (1970)
What is assessment? • Data collection with a purpose -- gather data about students’ learning.
What type of data do we gather? • Depends on the evidence we will accept that students have learned what we want them to learn. • Data must be aligned with the course goals. • Measures of knowledge, attitudes, and skills. • tests, extended responses, concept maps, • research papers, teamwork, communication
Functions of Assessment Data • Formative: diagnostic feedback to students/instructor • Summative: description of students’ level of attainment • Evaluative: curricular feedback to instructor • (e.g., effectiveness of field trip, lab investigation) • Educative: students engaged in interesting, challenging experiences to develop further insight and understanding (Hodson 1992)
In effect... • Assessment IS a form of learning.
Misconceptions => Assessment => Instruction • What data do you want from the assessment? • What do you do when you identify student misconceptions? • How will the data influence your instructional design?
Goal => Assessment • Students will be able to demonstrate their understanding of photosynthesis and cellular respiration. • Tools: multiple forms of assessment • Feedback loop to instructional design
Common Misconceptions: Photosynthesis & Respiration • Photosynthesis as Energy: Photosynthesis provides energy for uptake of nutrients through roots which builds biomass. No biomass built through photosynthesis alone. • Plant Altruism: CO2 is converted to O2 in plant leaves so that all organisms can ‘breathe’. • All Green: Plants have chloroplasts instead of mitochondria so they can not respire. • Thin Air: CO2 and O2 are gases therefore, do not have mass and therefore, can not add or take away mass from an organism.
Multiple choice question (pre-post) Plants gain a tremendous amount of weight (dry biomass) as they grow from seed to adult. Which of the following substances contributes most to that weight gain a. compounds dissolved in soil water that are take up by plant roots b. water c. molecules in the air that enter through holes in the plant leaves d. organic material in the soil taken up directly by plant roots e. solar radiation
Carbon Cycle Problem (mid) Two fundamental concepts in ecology are “energy flows” and “matter cycles”. In an Antarctic ecosystem with the food web given above, how could a carbon atom in the blubber of the Minke whale become part of a crabeater seal? Note: crabeater seals do not eat Minke whales. In your response include a drawing with arrows showing the movement of the C atom. In addition to your drawing, provide a written description of the steps the carbon atom must take through each component of the ecosystem Describe which biological processes are involved in the carbon cycle.
Grandma Johnson Problem • Hypothetical scenario: Grandma Johnson had very sentimental feelings toward Johnson Canyon, Utah, where she and her late husband had honeymooned long ago. Her feelings toward this spot were such that upon her death she requested to be buried under a creosote bush overlooking the canyon. Trace the path of a carbon atom from Grandma Johnson’s remains to where it could become part of a coyote. NOTE: the coyote will not dig up Grandma Johnson and consume any of her remains.
Radish Problem • Experimental Setup: • Weighed out 3 batches of radish seeds each weighing 1.5 g. • Experimental treatments: • 1. Seeds not moistened (dry) placed in LIGHT • 2. Seeds placed on moistened paper towels in LIGHT • 3. Seeds placed on moistened paper towels in DARK
Problem (cont) • After 1 week, all plant material was dried in an oven overnight (no water left) and plant biomass was measured in grams. • Predict the biomass of the plant material in the various treatments (use think-pair-share). • Light, No Water • Light, Water • Dark, Water
Results: Weight of Radish Seeds 1.46 g 1.63 g 1.20 g Write an explanation about the results. (Remember all treatments started as 1.5g).
Misconceptions => Assessment => Instruction • What data do you want from the assessment? • What do you do when you identify student misconceptions? • How will the data influence your instruction and the learning environment you create?
Gene-DNA-Chromosome • Students could explain transcription & translation but not the relation... “Gene-DNA-Chromosome.” • Concept mapping forces students to “Think different” and confront their (mis) understanding.
Concept Maps are Visual Diagrams or Models
Concept Maps are Visual Diagrams or Models Used for Organization Assessment promotes Reflection & Learning
Concept Maps are display Visual Diagrams or Models Concepts connected with Used for Linking Words Organization Assessment promotes Reflection & Learning
Concept Maps are display represent Visual Diagrams or Models Concepts Knowledge or Understanding connected with has has Hierarchy Structure Used for Linking Words Organization Assessment promotes Reflection & Learning
represent Knowledge or Understanding Used for is constructed with Organization Assessment Context promotes Prior Knowledge New Information Reflection & Learning Concept Maps are display Visual Diagrams Or Models Concepts connected with has has Hierarchy Structure Linking Words
low Potential for Assessment of Learning high high Ease of Assessment low • Theoretical Framework • Ausubel 1968; meaningful learning • Novak 1998; visual representations • King and Kitchner 1994; reflective judgement • National Research Council 1999; theoretical frameworks for assessment Assessment Gradient Multiple Choice … … Concept Maps … … Essay … … Interview
Make a draft of a concept map Take those three chapters, concepts from your class, and some post-it notes and make a concept map.
Steps to making a concept map • List the concepts: brain, genome, dog, plant • Arrange them - rank-order in terms of the top, most general, to at the bottom, most specific. • Add linking lines that connect the subordinate concepts under the broader ones. • Add linking words that indicate the relationship between two linked concepts e.g., connect to, are found in, build proteins inside.
Concepts • Photosynthesis Glucose • Respiration Energy • Carbon cycle Water • Decomposers Oxygen • Primary producers • Consumers • Carbon dioxide
Make a draft of a concept map Now form a group of three people, merge your post-its and make a concept map of all the science concepts.