Download
1 / 20
200 likes | 354 Views
Latha Sathiyamoorthy Mentor Dr Kern May 7 th 2013. Place of living influences physical activity, BMI, nutrient intake of Asian Indians. My sincere thanks to Dr. Mark Kern Dr. Lalitha Ramaswamy Dr. Susan Levy All study participants Aarti Sachdeva Alex Zawilski Carly Sullivan Family .

E N D
Latha Sathiyamoorthy Mentor Dr Kern May 7th 2013 Place of living influences physical activity, BMI, nutrient intake of Asian Indians
My sincere thanks to • Dr. Mark Kern • Dr. Lalitha Ramaswamy • Dr. Susan Levy • All study participants • Aarti Sachdeva • Alex Zawilski • Carly Sullivan • Family acknowledgements
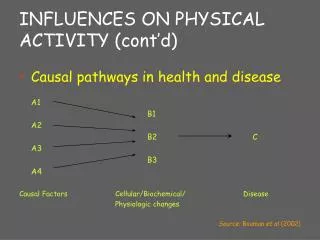
Background: Asian Indians in usa 46.6% Fig 1 Fig 2 117.7% U.S Census Bureau, 2010. Fig 3
Background: Leading cause of mortality among AI in California Palaniappan et al. 2010
Soaring cost of CVD www.cdc.gov 2011
No studies examined and compared the influence of place of living on PA, BMI and nutrient intake among the Asian Indians. Examine the PA, BMI and nutrient intake of Asian Indians living in San Diego and compare with those living in Coimbatore (South India) Purpose
Asian Indians in San Diego compared to their counterparts in Coimbatore will • be more physically active • have higher BMI • have higher energy intake • have greater nutrient intake Hypothesis
32 participants, male (N=16) female (N=16) Age group of 18 -60 years 15 San Diego, male (N=7) female (N=8) 17 Coimbatore, male (N=9) female (N=8) Inclusion and exclusion criteria Convenience non-random sampling Methods
Single 24-hr diet recall • Self-reported International Physical Activity Questionnaire (IPAQ) • Demographic questionnaire • self-reported height, weight, age, income, health info • BMI calculated (kg/m²) methods 1kg=2.2 lbs
BMI category • Under weight = <18.4 • Normal weight = 18.5 to 22.9 • Over weight = 23 to 24.9 • Obese = >25 WHO 2000,2003, 2004 • PA- METs (mins/week) was calculated • Craig et al., 2005;2004 • Nutrient analysis- Food Processor (SD) and AuroNutriSoft (Coimbatore) Methods
Participants from San Diego (SD) were grouped as living ≤ 10 yrs and > 10 years. Descriptive statistics [Mean ± Std Dev; frequencies(%)] for demographic variables Separate One-way ANOVAs (SPSS) were conducted to examine the differences in PA, BMI and nutrient intake of Asian Indians living in San Diego and in Coimbatore. Methods
Results and discussion *data is presented as Mean± SD OR Frequency (percentage)
Results and Discussion Cont’d Table 2 Physical activity, BMI and nutrient intake of Asian Indians living in San Diego and Coimbatore: Mean±SD
Results & discussion cont’d Table 3 Physical activity, BMI and nutrient intake of Asian Indians based on years of living in San Diego (Mean±SD)
Place of living impacted intake ofcertain macro and micronutrient ofAsian Indians. • carbohydrate (P= 0.031) • protein (P=0.031) • calcium (P=0.048) • vitamin A (P=0.001) • vitamin B12 (P=0.003) • manganese (P=0.001) • But no significant difference on PA, BMI, energy intake and certain nutrient intake between SD and Coimbatore was detected conclusion
Strength of the study • Pioneer study • Validated measures used • Limitations of the study • A single 24-hr dietary recall • Nutrient analysis software (standardization) • Non-random convenience sample • Type of study sample • Self reported information • Future study warranted • Large sample size • 24-hr diet recall → 2 days and 1 weekend • Blood samples – risk factors for chronic diseases
Omran AR. The epidemiologic transition: a theory of the epidemiology of population change. Milbank Q. 1971;49: 509-538. • Popkin BM. An overview on the nutrition transition and its health implications: The Bellagio meeting. Public Health Nutr. 2002 Feb; 5(1A): 93-103. • Ghai NR, Jacobsen SJ, Van Den Eeden SK, Ahmed AT, Haque R, Rhoads GG, Quinn VP. A comparison of lifestyle and behavioral cardiovascular disease risk factors between Asian Indian and White non-Hispanic men. Ethn Dis. 2012; 22: 168-174. • Lee WP, Lingard J, Bermingham M. Change in diet and body mass indeed in Taiwanese women with length of residence in Australia. Asian Pacific J ClinNutr. 2007;16:1:56-65. • Jonnalagadda SS, Diwan S. Nutrient intake of first generation Gujurati Asian Indian immigrants in the U.S. J Am CollNutr. 2002; 21:5:372-280. • Raj et al Dietary habits of Asian Indians in relation to length of residence in the U.S. J Am Diet Asso. 1999; 99: 9: 1106-1108. • Koya DL, Egede LE. Association between length of residence and cardiovascular disease risk factors among an ethnically diverse group of U.S. immigrants. Society of General Internal Medicine. 2007;22:841-846 • Das M, Pal S, Ghosh A. Prevalence of cardiovascular disease risk factors by habitat: A study on adult Asian Indians in West Bengal, India. J Biol Clinic Anthrop. 2011;68:3:253-264. • World Health Organization. The Asia-Pacific perspective: Redefining obesity and its treatment. Switzerland, Geneva. 2000. • Asian Indian population across U.S. Census 2010.available at http://newamericamedia.org/2011/05/census-asian-indian-population-explodes-across-us.php. Accessed March 4, 2013. • Institute of Medicine: Dietary Reference Intakes. Available at http://www.iom.edu/Activities/Nutrition/SummaryDRIs/~/media/Files/Activity%20Files/Nutrition/DRIs/5_Summary%20Table%20Tables%201-4.pdf. Accessed March 19, 2013. • Booth ML. Assessment of physical activity: An international perspective. Research Quarterly for Exercise and Sport. 2000; 71(2):114 -20. • U.S. Department of Health and Human Services. Physical Acitivty guidelines for Americans. 2008. Available at http://www.health.gov/paguidelines/guidelines/summary.aspx. Accessed April 1, 2013. • Craig CL, Marshall AL, Sjostrom M, Bauman AE, Booth ML, Ainsworth BE, et al. International physical activity questionnaire: 12-country reliability and validity. Medicine and Science in Sports and Exercise 2003; 35:1381–1395. • CDC 2011. Chronic disease prevention and health promotion. Heart disease and stroke prevention. Available at http://www.cdc.gov/chronicdisease/resources/publications/AAG/dhdsp.htm. Accessed 3rd April 2013. • WHO Expert Consultation: Appropriate body-mass index for Asian populations and its implications for policy and intervention strategies. Lancet, 2004;363:157-163. References