Download

1 / 42
420 likes | 426 Views
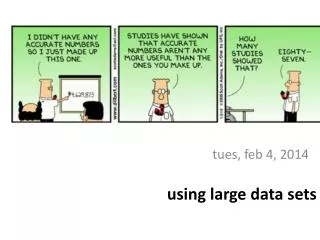
using large data sets. wed, jan 27, 2015. today ’ s line-up…. Survey research as a method General Social Survey GSS (dataset for our project) Project details, variables, think about groups SPSS & UNC Virtual Lab Example of project presentation. What is a survey?. A surve y is:.

E N D
using large data sets wed, jan 27, 2015
today’s line-up… • Survey research as a method • General Social Survey GSS (dataset for our project) • Project details, variables, think about groups • SPSS & UNC Virtual Lab • Example of project presentation
What is a survey? • A survey is:
What is a survey? • A survey is: • a systematic method for gathering information • from (a sample of) entities • for the purposes of constructing quantitative descriptors • of the attributes of the larger population of which the entities are members
typically, surveys… • Gather information by asking people questions • Collect information by either (1) interviewers asking questions and recording responses or (2) respondents reading and recording their own answers • Collect information from a subset of the population, a sample, rather than from all members
Polls vs. Surveys • No clear distinction between the two terms • “Poll” often used for private sector opinion studies • Use many of the same design features as studies that would be called surveys • “Poll” rarely used to describe government or scientific surveys • To me, the term poll implies either • A commercial or less-scientific study, or • A quick turn-around survey whose results may be of short-term interest
Based on probability design* *units are selected using a method that ensures that each unit has a known, nonzero probability of being included The SAGE Handbook of Online Research Methods (2008)
1936 election and the Literary Digest survey • Magazine had predicted every election since 1916 • Sent out 10 million surveys---and 2.4 million responded • They said: Landon would win 57% of the vote • What happened: 62% Roosevelt landslide
What went wrong? • Sample not representative • Lists came from subscriptions, phone directories, club members • Phones were a luxury in 1936 • Selection Bias toward the rich • Voluntary response: Republicans were angry and more likely to respond • Context: Great Depression • 9 million unemployed • Real income down 33% • Massive discontent, strike waves
Steps in conducting a survey • Clearly state research objective(s) • Decide on survey mode(s) • How will you contact potential respondents? (web, email, phone, etc.) • In what media will the survey be given? (web, email, phone, etc.) • Determine fielding strategy (how to maximize response rates?) • Design the survey questions and the survey instrument
Steps in conducting a survey • Determine sample size and sampling strategy • Obtain Institutional Review Board (IRB) or other approval as necessary • Are respondents promised confidentiality? • What is the impact if their survey responses become known? • Pre-test • Give the survey to some test subjects and get their feedback • What works and what doesn’t? • Are you getting correct data/information? • Revise and re-pre-test as necessary
General Social Survey • The GSS (General Social Survey) is a biannual personal interview survey of U.S. households conducted by the National Opinion Research Center (NORC). The first survey took place in 1972. • Approximately 3000 American adults are interviewed in person for about 90 minutes and asked around 450 questions.
Purpose of GSS • gather data on contemporary American society in order to monitor and explain trends and constants in attitudes, behaviors, and attributes over time • to compare the United States to other societies
General Social Survey • demographics & attitudes • The questionnaire contains a standard core of demographic and attitudinal variables, plus certain topics of special interest selected for rotation (called "topical modules") • Items include national spending priorities, drinking behavior, marijuana use, crime and punishment, race relations, quality of life, confidence in institutions, and membership in voluntary associations
Data to Story Project • Go over project description • Components • Project description • Search log • Annotated bibliography • Presentation [handout] Emphasize that GSS and statistical analysis are just the topical launch point; substance of project is in information search/retrieval, info analysis and info presentation
Get into the GSS dataset… • Download the dataset onto your computer or flashdrive • Go to class schedule for Jan 27 http://ils.unc.edu/courses/2016_spring/inls151_002/schedule.html • Right click on GSS 2014 Dataset to SAVE AS on your computer (file called “GSS2014.INLS151.sav”) • Log into the UNC Virtual Lab https://virtuallab.unc.edu • On the left under “Statistics”, select SPSS • Once the SPSS program opens, drill down to your computer to find the GSS2014.INLS151.SAV file to open the GSS dataset
variables • variable – a characteristic that can vary in value among subjects in a sample or a population. We are interested in similarities and differences - variance • types of variables • categorical • quantitative
categorical variable • scale for measurement is a set of categories • examples: • Racial-ethnic group (white, black, Hispanic) • Political party identification (Dem., Repub., Indep.) • Vegetarian? (yes, no) • Mental health evaluation (well, mild symptom formation, moderate symptom formation, impaired) • Happiness (very happy, pretty happy, not too happy) • Religious affiliation • Major
SPANKING: Categorical (Single) Do you strongly agree, agree, disagree, or strongly disagree that it is sometimes necessary to discipline a child with a good, hard spanking? Categories: Code as: {strongly_agree} Strongly agree 5 {agree} Agree 4 {disagree} Disagree 3 {strongly_disagree} Strongly disagree 2 {dontknow} DON'T KNOW 1 {refused} REFUSED 0 Sample question from GSS
scales of measurement for categorical variables, two types: • nominal scale– unordered categories • preference for president, race, gender, religious affiliation, major opinion items (favor vs. oppose, yes vs. no) • ordinal scale– ordered categories • political ideology (very liberal, liberal, moderate, conservative, very conservative) • anxiety, stress, self esteem (high, medium, low) • mental impairment (none, mild, moderate, severe) • government spending on environment (up, same, down)
nominal scale – unordered categories PRES12: Categorical (Single) Did you vote for Obama or Romney? Categories: Code as: Obama 5 Romney 4 Other Candidate (Specify) 3 Didn’t vote for president 2 Don’t know 1 Refused 0
ordinal scale – ordered categories POLVIEWS: Categorical (Single) We hear a lot of talk these days about liberals and conservatives. I'm going to show you a seven-point scale on which the political views that people might hold are arranged from extremely liberal--point 1—to extremely conservative--point 7. Where would you place yourself on this scale? Categories: Code as: Extremely liberal 7 Liberal 6 Slightly liberal 5 Moderate, middle of the road 4 Slightly conservative 3 Conservative 2 Extremely conservative 1 DON'T KNOW 0 REFUSED 8
quantitative variable • possible values differ in magnitude • examples: • Age, height • Annual income • Time spent on online each week • Reaction time to a stimulus • (e.g., cell phone while driving in experiment) • Number of “life events” in past year
use of statistics to describe, summarize, and explain or make sense of a given set of data
Comparison of mean and median • Mean • Uses all of the data • Has desirable statistical properties • Affected by extreme high or low values (outliers – example*) • May not best characterize skewed distributions • Median • Not affected by outliers • May better characterize skewed distributions *UNC Geography Majors Salaries Example
mid-1980's at the University of North Carolina, the average starting salary of geography students was well over $100,000
Correlation Causation
sample patterns from GSS data • median income of female respondents compared with average income of male respondents • median level of education of respondents who own a gun • number of female respondents who own a gun compared with number of male respondents who own a gun • average age of respondents who indicated the government should spend more on space exploration • self-reported level of happiness compared with income level
sample characteristics of the GSS • The sampling frame of the General Social Survey is all U.S. adults living in households. The sampling frame includes 97.3 % of all U.S. adults. • Who does not live in a household? • college students in dorms • military personnel in barracks • prisoners • elderly persons in retirement homes
Does the GSS sample really draw from all the adults in its sample frame? • After the GSS is sampled, only 70% of persons in the sample actually respond to the survey • 23% refuse or cut the survey off in the middle • 2% are unavailable or can’t be found • 5% are missing for other reasons • In general, a response rate of 60% or more is considered minimally acceptable, but you should check your results in any way you can.
You can look at actual GSS questionnaires http://www3.norc.org/gss+website/
where can you access SPSS? • Odum Institute • Davis Library 2nd floor – ask lab assistant • https://virtuallab.unc.edu • Lab in the Undergraduate Library (need to confirm)
Notes… • Bring a flash drive to the Odum lab on Monday – you may want to save your work • Davis Library >> Room 219 • The dataset that we are using (GSS 20124) is available for download on our class website • schedule>>Jan 27 • the dataset is a .sav format – only opens with SPSS
Homework #1: Analyzing a research article • Select one of the seven research articles linked from our class schedule (listed under readings for Jan 25) • Using the Analyzing Research Articles handout (also listed under Jan 25, need one?), critique the article • Focus on the purpose of the study, description of study design (participants, methods, how they collected data), data analysis and conclusions • Don’t worry about specific statistical analysis methods • Due Mon, Feb 8– print or email to me by class time • Format – whatever works for you (bullets, address some but not necessarily all questions/points from handout) • Worth up to 3 points (out of 100)
Rationale for assignment • Use evaluative strategies and vocabulary to examine a scholarly research product • (the “analyzing information” part of our class title) • Explore research that has been conducted using the same dataset that we will be using for our project, the General Social Survey