Download
1 / 31
310 likes | 408 Views
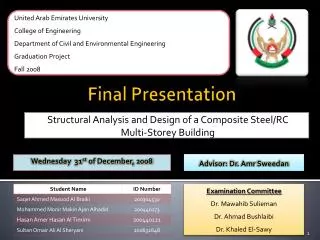
Tech Supply Chain Associates. Final Presentation. Milliken Asia Group II. April 25 2006. Rakshita Agrawal, Vishal Agrawal Aditya Dhanrajani, Michael Liebmann Uttam Malani, Jenny Zhang. Outline. A Project Overview B The Model C Results. Demand. Supply. Tokyo. Osaka.

E N D
Tech Supply Chain Associates Final Presentation Milliken Asia Group II April 25 2006 Rakshita Agrawal, Vishal Agrawal Aditya Dhanrajani, Michael Liebmann Uttam Malani, Jenny Zhang Project Presentation April 18 2006
Outline A Project Overview B The Model C Results Project Presentation April 18 2006
Demand Supply Tokyo Osaka Melbourne Seoul Auckland Bangkok Shanghai Beijing Chennai Taipei Mumbai Ho Chin Minh Sydney Jakarta Project Overview Kolkata Hong Kong Manila Spartanburg Kuala Lumpur Project Presentation April 18 2006
Problem Definition Collect Data Inventory Analysis Location Decision Determine Locations by minimizing overall costs Decision Based on Safety Stock and Service Level Project Presentation April 18 2006
Red & black 5 10 5 Red 5 5 10 Total number of cases 20 2 Periods x 2 Product sets x 5 Scenarios = 20 Cases Demand Data Overview A2005 E2010 Σ Project Presentation April 18 2006
Estimated change in product demand 2005 2010 4m 3m 2m 1m Red Red Red & Black Red & Black Strong growth projection more impact on profits Demand distribution and forecast Project Presentation April 18 2006
Outline A Project Overview B The Model C Results Project Presentation April 18 2006
2 Leasing rather than building warehouses ( no capacity constraint) 3 No warehouses in India Assumptions List of Assumptions 1 Local demand consolidated in demand cities and ports Project Presentation April 18 2006
Transportation cost Pipeline inventory cost WH leasing cost ai cj xij xij e xij bj ai ai Dij Decision variable Demand at point i Est. leasing cost at j Pipeline cost at j Demand at point i Decision variable Decision variable Demand at point i Est. transport cost Distance bn. i and j i Set of demand centers j Set of warehouses The Model Min [ Σi Σj e ai Dij xij + ΣiΣjai bj xij + ΣiΣjai cj xij ] Project Presentation April 18 2006
Port Accessibility Factor Routing example #1 Project Presentation April 18 2006
Port Accessibility Factor Routing example #2 Project Presentation April 18 2006
Outline A Project Overview B The Model C Results Project Presentation April 18 2006
Tokyo Osaka Taipei Seoul Auckland Bangkok Melbourne Shanghai Beijing Ho Chin Minh Mumbai Chennai Jakarta Sydney Location MappingScenario: Red & Black 2005 Scenario #1: I WH Kolkata Hong Kong Manila Kuala Lumpur Project Presentation April 18 2006
Tokyo Osaka Ho Chin Minh Auckland Melbourne Shanghai Beijing Mumbai Chennai Jakarta Sydney Location MappingScenario: Red & Black 2005 Scenario #2: II WHs Seoul Kolkata Taipei Hong Kong Manila Bangkok Kuala Lumpur Project Presentation April 18 2006
Tokyo Osaka Sydney Auckland Melbourne Shanghai Beijing Ho Chin Minh Mumbai Chennai Jakarta Location MappingScenario: Red & Black 2005 Scenario #3: III WHs Seoul Kolkata Taipei Hong Kong Manila Bangkok Kuala Lumpur Project Presentation April 18 2006
Tokyo Osaka Auckland Shanghai Beijing Ho Chin Minh Mumbai Chennai Jakarta Location MappingScenario: Red & Black 2005 Scenario #4: IV WHs Seoul Kolkata Taipei Hong Kong Manila Bangkok Kuala Lumpur Sydney Melbourne Project Presentation April 18 2006
Tokyo Osaka Sydney Auckland Melbourne Shanghai Beijing Ho Chin Minh Mumbai Chennai Jakarta Location MappingScenario: Red & Black 2005 Scenario #5: V WHs Seoul Kolkata Taipei Hong Kong Manila Bangkok Kuala Lumpur Project Presentation April 18 2006
1 Taipei Taipei 2 Ho Chin Minh City, Seoul Bangkok, Shanghai 3 Bangkok, Sydney, Seoul Bangkok, Sydney, Shanghai 4 Taipei, Seoul,Bangkok, Melbourne Taipei, Seoul, Bangkok,Sydney 5 Bangkok, Seoul, Taipei, Sydney, Osaka Bangkok, Seoul , Taipei,Sydney Osaka Location Matrix for All Five CasesScenario: Red & Black 2005 & 2010 # DCs 2005 2010 Project Presentation April 18 2006
1 Taipei Taipei 2 Ho Chin Minh City, Seoul Bangkok, Shanghai 3 Bangkok, Sydney, Seoul Bangkok, Sydney, Shanghai 4 Taipei, Seoul,Bangkok, Melbourne Taipei, Seoul, Bangkok,Sydney 5 Bangkok, Seoul, Taipei, Sydney, Osaka Bangkok, Seoul , Taipei,Sydney Osaka Location Matrix for All Five CasesScenario: Red & Black 2005 & 2010 # DCs 2005 2010 Project Presentation April 18 2006
Tokyo Osaka Seoul Kolkata Hong Kong Bangkok 0-2 days Kuala Lumpur 2-4 days 4-7days Sydney Melbourne Auckland Shanghai Beijing Chennai Ho Chin Minh Mumbai Taipei Jakarta Manila Service Level 2005 Coverage Radii for 3 WHs Project Presentation April 18 2006
Demand Coverage 2005 Red & Black 2005 Project Presentation April 18 2006
Demand Coverage 2010 Red & Black 2010 Project Presentation April 18 2006
Safety Stock Considerations Safety Stock Red & Black 2005 Service Level 97% Lead time 5 weeks Lead time variability 0.5 week Project Presentation April 18 2006
1 1 Recommendations for location of warehouses & associated inventory levels Special Economic Zones (SEZ’s) and Free Trade Areas 2 2 Evaluation of scenarios based on projected demand data for 2010 Frequency of shipping from Spartanburg to Asia 3 3 Optimization tool for Milliken to accommodate changing needs and customer base Effect of transshipment hubs like Singapore on lead times Conclusions Summary Further Considerations Project Presentation April 18 2006
Tech Supply Chain Associates Thank you Q&A Project Presentation April 18 2006
Thank you Backup Project Presentation April 18 2006
Safety Stock & Service LevelRed 2005 Safety Stock Red 2005 Service Level Red 2005 Project Presentation April 18 2006
Safety Stock & Service LevelRed & Black 2005 Safety Stock Red & Black 2005 Service Level Red & Black 2005 Project Presentation April 18 2006
Safety Stock & Service LevelRed 2010 Safety Stock Red 2010 Service Level Red 2010 Project Presentation April 18 2006
Safety Stock & Service LevelRed & Black 2010 Safety Stock Red & Black 2010 Service Level Red & Black 2010 Project Presentation April 18 2006
Backup slidesSafety stock calculation Project Presentation April 18 2006