Download
1 / 485
4.87k likes | 5.38k Views
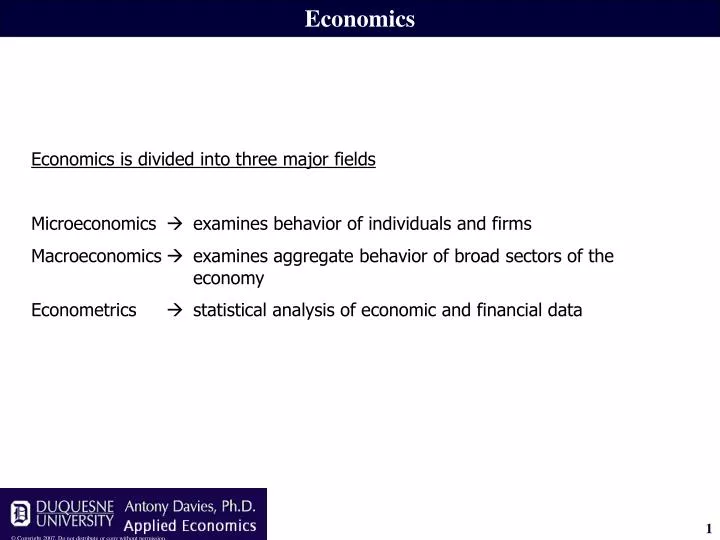
Economics. Economics is divided into three major fields Microeconomics examines behavior of individuals and firms Macroeconomics examines aggregate behavior of broad sectors of the economy Econometrics statistical analysis of economic and financial data.

E N D
Economics Economics is divided into three major fields Microeconomics examines behavior of individuals and firms Macroeconomics examines aggregate behavior of broad sectors of the economy Econometrics statistical analysis of economic and financial data
Fundamental Principles of Economic Behavior • Some choices involve accounting (“explicit”) costs, but all choices involve opportunity costs. • Accounting cost is the giving up of A in order to obtain B. • Opportunity cost is the failure to obtain C because you obtained B. • Economic cost is accounting cost plus opportunity cost. Example A firm hires a worker for $70,000 (including benefits). The firm’s weighted average cost of capital is 15%. The explicit cost of the worker is $70,000 per year. This is what the firm gives up in order to obtain the worker. The opportunity cost of the worker is ($70,000)(0.15) = $10,500. This is the amount of money the firm could have earned, but failed to earn, had the firm invested the $70,000 elsewhere. The economic cost of the worker is $70,000 + $10,500 = $80,500.
Fundamental Principles of Economic Behavior • Some choices involve accounting (“explicit”) costs, but all choices involve opportunity costs. • People make decisions at-the-margin. Example A firm spends $100 million on building a new factory. The amortized cost of the factory is $10 million annually. The new factory will cost $8 million to operate annually. The factory is expected to bring in an additional $25 million in revenue annually. After the factory is completed, economic conditions change such that the expected revenue to be generated by the factory drops to $5 million. Should the firm operate or shut-down the factory (note: shutting down does not recoup the $100 million cost of the factory)?
Fundamental Principles of Economic Behavior • Some choices involve accounting (“explicit”) costs, but all choices involve opportunity costs. • People make decisions at-the-margin. Example Some managers will be tempted to operate the factory because of the $100 million invested. This is called the sunk cost fallacy. The sunk cost fallacy arises when one fails to make decisions at-the-margin. A decision at-the-margin looks only at changes given current conditions. In this case, the given condition is that the factory exists. The choice to operate or not is irrelevant to the $100 million investment. Operate the factory Annual profit = $5 million – $8 million – $10 million = – $13 million Shutdown the factory Annual profit = $0 million – $0 million – $10 million = – $10 million
Fundamental Principles of Economic Behavior • Some choices involve accounting (“explicit”) costs, but all choices involve opportunity costs. • People make decisions at-the-margin. • People respond to incentives. Where people are concerned, we call this utility maximization. Where firms are concerned, we call this profit maximization. Example Stockholders can mitigate portfolio risk by diversifying their stock holdings. Therefore, they will want to hold individual stocks that have greater expected returns and greater risks rather than individual stocks that have lesser expected returns and lesser risks. As a result, stockholders want CEO’s to take risks in pursuit of greater profits.
Fundamental Principles of Economic Behavior • Some choices involve accounting (“explicit”) costs, but all choices involve opportunity costs. • People make decisions at-the-margin. • People respond to incentives. Problem If a risk goes bad, the CEO will be fired CEO has incentive not to take risks. How can stockholders motivate CEO’s to take risks? “Golden parachute” – guarantee the CEO that, in the event the CEO is fired, CEO will receive a large lump-sum payment from the company.
Fundamental Principles of Economic Behavior • Some choices involve accounting (“explicit”) costs, but all choices involve opportunity costs. • People make decisions at-the-margin. • People respond to incentives. • Other Examples • Soviet nail manufacturers produced huge, multi-ton nails. • In Russia, dead light bulbs sold for more than live light bulbs. • Traffic monitoring devices reduce side-impact, but cause rear-end collisions.
Fundamental Principles of Economic Behavior • Some choices involve accounting (“explicit”) costs, but all choices involve opportunity costs. • People make decisions at-the-margin. • People respond to incentives. • Exchange is (usually) not a zero-sum game. Zero-sum game: A situation in which what one person gains, the other loses. In an exchange, both parties can end up better off than they were at the outset. Example Person A owns a car that he would like to sell. Person A has full knowledge of the condition of the car. Given his need to drive, desire for style/comfort, etc., Person A places a subjective value of $10,000 on the car. This means that Person A would accept nothing less than $10,000 in exchange for the car.
Fundamental Principles of Economic Behavior • Some choices involve accounting (“explicit”) costs, but all choices involve opportunity costs. • People make decisions at-the-margin. • People respond to incentives. • Exchange is (usually) not a zero-sum game. Example Person B also has full knowledge of the condition of the car. Given her need to drive, etc., Person B places a subjective value of $12,000 on the car. This means that Person B would pay any price up to, but not more than, $12,000 in exchange for the car.
Fundamental Principles of Economic Behavior • Some choices involve accounting (“explicit”) costs, but all choices involve opportunity costs. • People make decisions at-the-margin. • People respond to incentives. • Exchange is (usually) not a zero-sum game. Example A reservation price is the minimum price the seller is willing to accept or the maximum price the buyer is willing to pay. Seller’s reservation price = $10,000 Buyer’s reservation price = $12,000 If Person B pays $11,000 for the car, Person B gains $1,000 of value ($12,000 car value less $11,000 price), and Person A gains $1,000 of value ($11,000 price less $10,000 car value).
Fundamental Principles of Economic Behavior • Some choices involve accounting (“explicit”) costs, but all choices involve opportunity costs. • People make decisions at-the-margin. • People respond to incentives. • Exchange is (usually) not a zero-sum game. • The world is non-linear. Assuming that the world is linear results in erroneous expectations. Example A firm employs 100 workers who, together, produce 100,000 bottles of beer daily. Linear assumption: 200 workers will produce 200,000 bottles of beer daily. Non-linear reality: Factory cannot accommodate 200 workers. Overcrowding puts downward pressure on output 200 workers produce only 140,000 bottles.
Fundamental Principles of Economic Behavior • Some choices involve accounting (“explicit”) costs, but all choices involve opportunity costs. • People make decisions at-the-margin. • People respond to incentives. • Exchange is (usually) not a zero-sum game. • The world is non-linear. Linear assumption: Double the workers and the factory size to produce 200,000 bottles of beer daily. Non-linear reality: Managers are limited in the number of workers they can manage. Without adding an extra layer of management, inefficiencies put downward pressure on output doubled workers and factory space produce only 180,000 bottles.
Terminology Product A good or service. Good An object that is desirable. Durable good A good that is consumed over a long period of time. Service An action that is desirable. Attributes Color, taste, smell, size, price, durability, etc. Salient attributes are attributes that are important to the consumer. Brand A variety of a product identified from other varieties by a commercial name and/or other distinctive attributes. Consumer One who desires to purchase a product. End-user A consumer who will not resell a product. Producer One who offers a product for sale. Manufacturer One who creates a product. Retailer One who sells, but does not manufacture, a product. Factor Labor, materials, capital a producer uses to produce a product. Capital Buildings, land, machinery used in the production of a product. Also called property, plant, and equipment (PP&E). Market Interaction of consumers and producers of a given product.
Markets A market forms when consumers and producers of a product come together. The behavior of the consumer is summarized by demand. The behavior of the producer is summarized by supply. Later, we will examine instances in which markets are influenced by government intervention and foreign competition. For the moment, we will focus on the simple case in which the only players in the market are the producers and consumers.
Relationship between price and quantity is demand. Amount the consumer wants to buy is quantity demanded. Demand Demand The relationship between the number of units of a product a consumer is willing to buy and the price of the product. Incorrect: “When the price of the product falls, demand rises.” Correct: “When the price of the product falls, the quantity demanded rises.”
Demand Demand The relationship between the number of units of a product a consumer is willing to buy and the price of the product. Figures from the table can be plotted to form a graph of demand.
Positive Consumer Shock 160 Demand Any event that alters the demand relationship is called a consumer shock. A positive consumer shock causes consumers to want to purchase more units of the product at all price levels. A negative consumer shock causes consumers to want to purchase fewer units of the product at all price levels.
If price had stayed at $20, consumers would not want to buy more. Demand A change in the price of a good is not a shock because the price change does not alter the relationship between price and quantity demanded. When the price falls, consumers want to buy more of the product, but they don’t want to buy more of the product at all price levels.
Demand • Typical Consumer Shocks • Change in consumers’ purchasing power. • Increase (decrease) in purchasing power is a positive (negative) shock. • 2. Change in price of a substitute product. • Increase (decrease) in price of a substitute is a positive (negative) shock. E.g. increase in price of coffee increases demand for tea. • Change in price of a complement product. • Increase (decrease) in price of a complement is a negative (positive) shock. E.g. increase in price of charcoal decreases demand for lighter fluid. • Change in consumer preferences. • Increase (decrease) in preferences is a positive (negative) shock. • Change in number of consumers. • Increase (decrease) in number of consumers is a positive (negative) shock.
Relationship between price and quantity is supply. Amount the producer wants to sell is quantity supplied. Supply Supply The relationship between the number of units of a product a producer is willing to offer and the price of the product. Incorrect: “When the price of the product falls, supply falls.” Correct: “When the price of the product falls, the quantity supplied falls.”
Supply Supply The relationship between the number of units of a product a producer is willing to offer and the price of the product. Figures from the table can be plotted to form a graph of demand.
Positive Producer Shock Supply Any event that alters the supply relationship is called a producer shock. A positive producer shock causes producers to want to offer more units of the product at all price levels. A negative producer shock causes producers to want to offer fewer units of the product at all price levels.
If price had stayed at $20, producers would not want to offer fewer units. Supply A change in the price of a good is not a shock because the price change does not alter the relationship between price and quantity supplied. When the price falls, producers want to offer fewer units of the product, but they don’t want to offer fewer units at all price levels.
Supply • Typical Producer Shocks • Change in producers’ technology. • Increase (decrease) in technology is a positive (negative) shock. • 2. Change in prices of factors. • Increase (decrease) in price of a factor is a negative (positive) shock. E.g. increase in price of steel decreases supply of cars. • 3. Change in the number of producers. • Increase (decrease) in number of producers is a positive (negative) shock.
Identifying Shocks First Identify the market under scrutiny, and the consumers/producers of the market’s product. Consumer Shocks vs. Producer Shocks A shock is a consumer shock if it impacts consumers first and producers (if at all) only as a result of the impact on consumers. A shock is a producer shock if it impacts producers first and consumers (if at all) only as a result of the impact on producers. Positive Shocks vs. Negative Shocks A shock is a positive shock if it makes it easier or more attractive for producers/consumers to produce/consume. A shock is a negative shock if it makes it harder or less attractive for producers/consumers to produce/consume.
Identifying Shocks Example Refusing entry visas to Canadian loggers who, previously, cut trees in Maine for use as pulpwood is what sort of shock to the American paper markets? • 1. Identify the market • Market for American-made paper • 2. Identify the producers • American paper manufacturers • 3. Identify the consumers • Those who buy American paper • 4. Identify the target of the shock (consumer shock or producer shock) • Producer shock • Identify the direction of the shock (positive or negative) • Negative shock • Identify the impact on demand/supply • Supply of paper decreases
According to the supply curve, producers will offer 100 units per day. According to the demand curve, consumers will seek to purchase 150 units per day. A shortage is a situation in which QD > QS Shortage = 50 units per day Shortage, Surplus, and Equilibrium Suppose the price of a product is $16.
Competition by consumers for a limited quantity of product puts upward pressure on price. As price rises, QS increases and QD decreases, reducing the shortage. Shortage, Surplus, and Equilibrium Producers experience a shortage as a reduction in inventories (for goods producers) or limited capacity (for service producers).
Equilibrium price Equilibrium point Equilibrium quantity Shortage, Surplus, and Equilibrium Eventually, the price rises to a point such that the shortage is completely eliminated. With the shortage gone, consumers no longer compete for a limited quantity of product, and so the price stops rising.
According to the demand curve, consumers will seek to purchase 100 units per day. According to the supply curve, producers will offer 140 units per day. A surplus is a situation in which QD < QS Surplus = 40 units per day Shortage, Surplus, and Equilibrium Suppose the price of a product is $20.
Competition by producers for a limited quantity of sales puts downward pressure on price. As price falls, QD increases and QS decreases, reducing the surplus. Shortage, Surplus, and Equilibrium Producers experience a surplus as an increase in inventories (for goods producers) or excess capacity (for service producers).
Equilibrium price Equilibrium point Equilibrium quantity Shortage, Surplus, and Equilibrium Eventually, the price falls to a point such that the surplus is completely eliminated. With the surplus gone, producers no longer compete for a limited quantity of sales, and so the price stops falling.
Shortage, Surplus, and Equilibrium Shortage QD > QS Competition among consumers causes price to rise Surplus QD < QS Competition among producers causes price to fall Equilibrium QD = QS No competition and so no price change
Regression Analysis In regression analysis, we look at how one variable (or a group of variables) can affect another variable. We use a technique called “ordinary least squares” or OLS. The OLS technique looks at a sample of two (or more) variables and filters out random noise so as to find the underlying deterministic relationship among the variables. Example: A retailer suspects that monthly sales follow unemployment rate announcements with a one-month lag. When the Bureau of Labor Statistics announces that the unemployment rate is up, one month later, sales appear to fall. When the BLS announces that the unemployment rate is down, one month later, sales appear to rise. The retailer wants to know if this relationship actually exists. If so, the retailer can use BLS announcements to help predict future sales. In linear regression analysis, we assume that the relationship between the two variables (in this example, sales and unemployment rate) is linear and that any deviation from the linear relationship must be due to noise (i.e. unaccounted randomness in the data).
Regression Analysis Example: The chart below shows data (see Data Set #4) on sales and the unemployment rate collected over a 10 month period. Notice that the relationship (if there is one) between the unemployment rate and sales is subject to some randomness. Over some months (e.g. May to June), an increase in the previous month’s unemployment rate corresponds to a decrease in the current month’s sales. But, over other months (e.g. June to July), an increase in the previous month’s unemployment rate corresponds to an increase in the current month’s sales.
Regression Analysis Example: It is easier to picture the relationship between unemployment and sales if we graph the data. Since we are hypothesizing that changes in the unemployment rate cause changes in sales, we put unemployment on the horizontal axis and sales on the vertical axis.
Slope = –11,648,868 Vertical intercept = 771,670 Regression Analysis Example: OLS finds the line that most closely fits the data. Because we have assumed that the relationship is linear, two numbers describe the relationship: (1) the slope, and (2) the vertical intercept.
After eliminating noise, we estimate that sales should have been 771,670 – (11,648,868)(0.045) = $247,471 …is observed with sales of $257,151 True intercept and slope Noise (also called “error term”) Estimated intercept, slope, and sales after estimating and removing noise Unemp rate of 4.5%… Regression Analysis • The graph below shows two relationships: • The regression model is the scattering of dots and represents the actual data. • The estimated (or fitted) regression model is the line and represents the regression model after random noise has been removed. Regression model Estimated regression model
Regression Analysis Terminology: Variables on the right hand side of the regression equation are called exogenous, or explanatory, or independent variables. They usually represent variables that are assumed to influence the left hand side variable. The variable on the left hand side of the regression equation is called the endogenous, or outcome, or dependent variable. The dependent variable is the variable whose behavior you are interested in analyzing. The intercept and slopes of the regression model are called parameters. The intercept and slopes of the estimated (or fitted) regression model are called estimated parameters. The noise term in the regression model is called the error or noise. The estimated error is called the residual, or estimated error. Regression model Fitted (estimated) model Explanatory variable Fitted (estimated) outcome variable Error (noise) Residual (estimated error) Outcome variable Parameter estimates Parameters
Regression Analysis OLS estimates the regression model parameters by selecting parameter values that minimize the variance of the residuals. = Residual difference between actual and fitted values of the outcome variable.
Regression Analysis OLS estimates the regression model parameters by selecting parameter values that minimize the variance of the residuals. = Residual difference between actual and fitted values of the outcome variable. Choosing different parameter values moves the estimated regression line away (on average) from the data points. This results in increased variance in the residuals.
Regression Analysis To perform regression in Excel: (1) Select TOOLS, then DATA ANALYSIS (2) Select REGRESSION
Regression Analysis To perform regression in Excel: (3) Enter the range of cells containing outcome (“Y”) and explanatory (“X”) variables (4) Enter a range of cells for the output Constant is zero Check this box to force the vertical intercept to be zero. Confidence level Excel automatically reports 95% confidence intervals. Check this box and enter a level of confidence if you want a different confidence interval. Residuals Check this box if you want Excel to report the residuals. Standardized residuals Check this box if you want Excel to report the residuals in terms of standard deviations from the mean.
Regression Analysis Regression results 95% confidence interval around parameter estimate Vertical intercept estimate Test statistic and p-value for H0: parameter = 0 Slope estimate Standard deviation of slope estimate Standard deviation of vertical intercept estimate
Distribution of Regression Parameter Estimates If we select a different sample of observations from a population and then perform OLS, we will obtain slightly different parameter estimates. Thus, regression parameter estimates are random variables. The properties of a regression parameter estimates:
Distribution of Regression Parameter Estimates Regression demo Enter population values here. Spreadsheet selects a sample from the population and calculates parameter estimates based on the sample. Press F9 to select a new sample.
Multiple Regression Analysis In multiple regression analysis the OLS technique finds the linear relationship between an outcome variable and a group of explanatory variables. As in simple regression analysis, OLS filters out random noise so as to find the underlying deterministic relationship. OLS also identifies the individual effects of each of the multiple explanatory variables. Simple regression Multiple regression
Multiple Regression Analysis Example: A trucking company wants to be able to predict the round-trip travel time of its trucks. Data Set #6 contains historical information on miles traveled, number of deliveries per trip, and total travel time. Use the information to predict a truck’s round-trip travel time. Approach #1: Calculate Average Time per Mile Trucks in the data set required a total of 87 hours to travel a total of 4,000 miles. Dividing hours by miles, we find an average of 0.02 hours per mile journeyed. Problem: This approach ignores a possible fixed effect. For example, if travel time is measured starting from the time that out-bound goods begin loading, then there will be some fixed time (the time it takes to load the truck) tacked on to all of the trips. For longer trips this fixed time will be “amortized” over more miles and will have less of an impact on the time/mile ratio than for shorter trips. This approach also ignores the impact of the number of deliveries.
Multiple Regression Analysis Example: A trucking company wants to be able to predict the round-trip travel time of its trucks. Data Set #6 contains historical information on miles traveled, number of deliveries per trip, and total travel time. Use the information to predict a truck’s round-trip travel time. Approach #2: Calculate Average Time per Mile and Average Time per Delivery Trucks in the data set averaged 87 / 4,000 = 0.02 hours per mile journeyed, and 87 / 29 = 3 hours per delivery. Problem: Like the previous approach, this approach ignores a possible fixed effect. This approach does account for the impact of both miles and deliveries, but the approach ignores the possible interaction between miles and deliveries. For example, trucks that travel more miles likely also make more deliveries. Therefore, when we combine the time/miles and time/delivery measures, we may be double-counting time.
Multiple Regression Analysis Example: A trucking company wants to be able to predict the round-trip travel time of its trucks. Data Set #6 contains historical information on miles traveled, number of deliveries per trip, and total travel time. Use the information to predict a truck’s round-trip travel time. Approach #3: Regress Time on Miles The regression model will detect and isolate any fixed effect. Problem: The model ignores the impact of the number of deliveries. For example, a 500 mile journey with 4 deliveries will take longer than a 500 mile journey with 1 delivery.