Download
1 / 21
210 likes | 331 Views
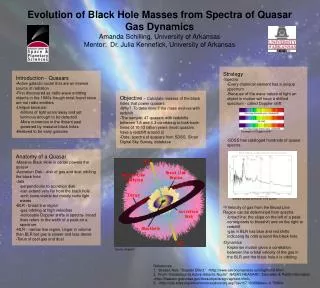
The dependence on redshift of quasar black hole masses from the SLOAN survey. Marzia Labita. R. Decarli Università dell’Insubria, Como, Italy A. Treves Università dell’Insubria, Como, Italy R. Falomo INAF, Osservatorio Astronomico di Padova, Italy. SMBHs and host galaxies.

E N D
The dependence on redshift of quasar black hole masses from the SLOAN survey Marzia Labita R. DecarliUniversità dell’Insubria, Como, Italy A. TrevesUniversità dell’Insubria, Como, Italy R. FalomoINAF, Osservatorio Astronomico di Padova, Italy
SMBHs and host galaxies • Most (if not all) nearby (early type) galaxies host a supermassive black hole (SMBH) at their centers - proper motion of stars (Milky Way) - rotation curves of gas clouds – MASER (22 objects) • The host galaxies of low redshift quasars contain a massive spheroidal component (observative results) (Ferrarese 2006 for a review) Elliptical galaxies ↔ SMBHs AGN8
Joint formation of SMBHs and massive spheroids • According to the hierarchical merging scenario, massive spheroids should be the products of successive merging events • At low redshift, the central BH mass is strongly correlated to the properties of the host galaxy bulge (of both active and inactive galaxies) …OUTSIDE THE SPHERE OF INFLUENCE! Formation of Formation and fuelling Elliptical galaxies of their active nuclei AGN8
Quasar – Host Galaxy connection: • Host galaxy luminosity (mass) dependence on redshift • Study the BH – host mass correlation at low z and trace its cosmological evolution close and beyond the peak of the quasar activity • BH mass dependence on redshift McLure & Dunlop SDSS Shen et al. SDSS Fine et al. 2dF SLOAN AGN8
SDSS Sloan Digital Sky Survey(Fifht data release) • 8000 square degrees imaged • 1000000 spectra • 90000 quasars (0.1 < z < 4.5) …of which: 50000 quasars for which MgII line width and 3000Å monochromatic flux are available (0.35 < z < 2.3) • Uniform BH mass determinations: (McLure & Dunlop 2004) AGN8
Absolute magnitude and BH mass vs. redshift Malmquist Bias ? AGN8
GROWING REDSHIFT The luminosity-FWHM plane AGN8
Constant luminosity The luminosity-FWHM plane AGN8
Constant luminosity Constant BH mass The luminosity-FWHM plane AGN8
Constant luminosity Constant BH mass Constant Eddington ratio The luminosity-FWHM plane AGN8
MMAX LMIN EMAX The luminosity-FWHM plane AGN8
MMAX LMIN EMAX The luminosity-FWHM plane PROBABILITY DENSITY: AGN8
MMAX LMIN σM σL 6 FREE PARAMETERS: EMAX σE Focus on the lowest redshift sample:Description of the assumed probability density AGN8
Best fit to the luminosity-FWHM distribution • Construction of the discrete observed distribution: • Division in boxes with ΔlogλLλ=0.15; ΔlogFWHM=0.04 • Number of objects in each box • Construction of the discrete expected distribution from the assumed probability density: • Discretization in boxes • Normalization to the observed number of objects • Evaluation of the best fit parameters: • For each choice of the 6 free parameters, evaluation of the rms between the observed and the expected distributions • Minimization of the rms BEST FIT PARAMETERS Contour plot = Levels of constant probability Errors on the best fit parameters: MONTE CARLO SIMULATIONS AGN8
Contour plot of a sample of quasars simulated adopting the best fit probability density (Monte Carlo simulation) Contour plot of the observed quasar sample Contour plot of the residuals between the observed and the simulated distributions Comparison between the observed and the expected distribution AGN8
LMIN is a free parameter LMIN is a NOT a free parameter: its dependence on redshift is fixed by COSMOLOGY GROWING REDSHIFT Best fit parameters in function of redshift The rms of the best fit is almost the same in all the redshift bins. (If we assumed that MMAX is constant redshift, the fit would be awful!) The best fit parameters MMAX(z) and EMAX(z) give the (unbiassed!) dependence on redshift of the maximum mass and Eddington ratio AGN8
Evolution of the quasar populations with the Cosmic Time: EDDINGTON RATIO AGN8
This work Simple mean Evolution of the quasar populations with the Cosmic Time: EDDINGTON RATIO AGN8
Evolution of the quasar populations with the Cosmic Time: MASS Log (MBH MAX/MSUN ) = 1/3 z + 9 AGN8
This work Simple mean Fine et al. Evolution of the quasar populations with the Cosmic Time: MASS Log (MBH MAX/MSUN ) = 1/3 z + 9 AGN8
Conclusions The maximum mass of quasar populations seems to decrease with Cosmic Time i.e. the more a BH is massive, the earliest it starts its quasar activity Future • Use C IV line to study this trend till z=4.5 • Compare and contrast this trend in RQQs and RLQs • Compare this results with the bulge mass evolution with redshift • … WORK IN PROGRESS! AGN8