Download
1 / 1
10 likes | 80 Views
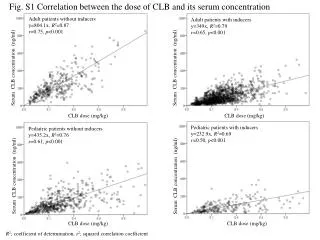
16. 16. 14. 14. 12. 12. Nitrogen limited (NLB). Carbon limited (CLB). 10. 10. 8. 8. 6. 6. Nutrient replete (RB). 6. 8. 10. 12. 14. 16. 6. 8. 10. 12. 14. 16. Nutrient replete (RB). 16.

E N D
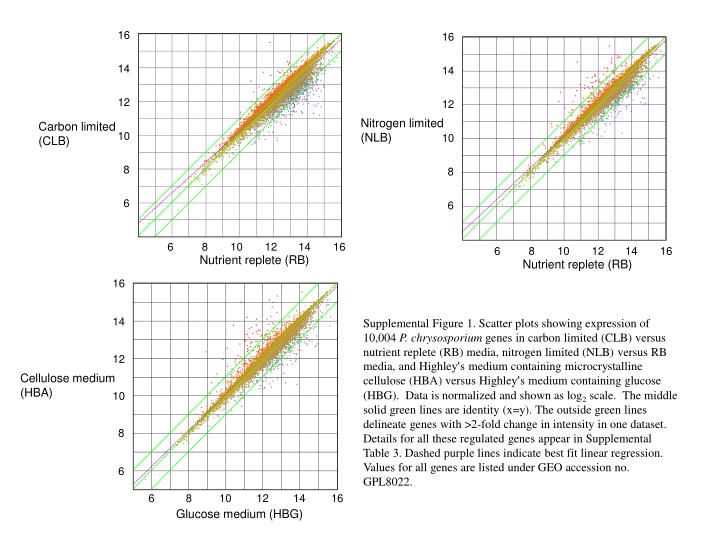
16 16 14 14 12 12 Nitrogen limited (NLB) Carbon limited (CLB) 10 10 8 8 6 6 Nutrient replete (RB) 6 8 10 12 14 16 6 8 10 12 14 16 Nutrient replete (RB) 16 Supplemental Figure 1. Scatter plots showing expression of 10,004 P. chrysosporium genes in carbon limited (CLB) versus nutrient replete (RB) media, nitrogen limited (NLB) versus RB media, and Highley’s medium containing microcrystalline cellulose (HBA) versus Highley’s medium containing glucose (HBG). Data is normalized and shown as log2 scale. The middle solid green lines are identity (x=y). The outside green lines delineate genes with >2-fold change in intensity in one dataset. Details for all these regulated genes appear in Supplemental Table 3. Dashed purple lines indicate best fit linear regression. Values for all genes are listed under GEO accession no. GPL8022. 14 12 Cellulose medium (HBA) 10 8 6 6 8 10 12 14 16 Glucose medium (HBG)