Download
1 / 29
290 likes | 393 Views
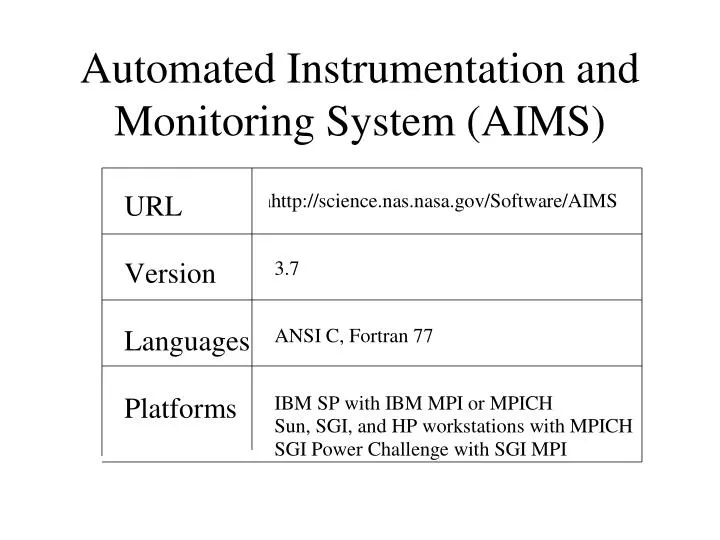
Automated Instrumentation and Monitoring System (AIMS). AIMS Components. Source code instrumentors xinstrument batch_inst Monitoring library Analysis tools View Kernel ( VK ) tally statistics generator. xinstrument.

E N D
AIMS Components • Source code instrumentors • xinstrument • batch_inst • Monitoring library • Analysis tools • View Kernel (VK) • tally statistics generator
xinstrument • GUI allows user to select specific source code constructs to be instrumented • Default is to instrument all communication routines • Other possibilities • All subroutines • All I/O • Enable by Type • Point and click on particular constructs in Construct Tree diagrams
xinstrument (cont.) • Regards source code as nested collection of constructs • conditionals • loops • subroutines • communication calls • Instrumented construct is replaced or surrounded by calls to AIMS monitor routines • Execution of instrumented construct generates time-stamped event
Files created by xinstrument • The following files are created by xinstrument and placed in ./inst or designated output directory • Instrumented source code • AIMS.monrc - parameters from Settings pane plus other options • Application database • default name is APPL_DB • Stores information about static structure of application • Used by analysis tools to relate traced events to Instrumented constructs • Incorporated at beginning of trace file • Profile • Table of flags, one for each construct in The application database • Can be edited to change instrumentation
batch_inst • Command-line instrumentor batch_inst [-options] [filenames] where options include:
Compiling and Running Instrumented Code • Copy necessary files to inst directory • Makefile • Header files • Source files not instrumented • Input files
Compiling and Running (cont.) • Link with AIMS MPI monitor library MON_LIB = $(AIMS_DIR)/lib app: $(F77) -o app_program $(APP_OBJS) $(MON_LIB)/mpilib.a • Set $AIMS_TMP_DIR environment variable to location to store local trace files • Make sure AIMS scripts and executables are in your path • Per-process trace files are automatically collected and merged at end of execution
Visualizing Trace Files with VK • View Kernel (VK) animates a trace file • VCR-like controls for tracefile playback • Can set breakpoints by time or in specific source code constructs • Source code click-back capability • Timeline display • Spokes view animates messages passed between tasks
Timeline Display • Toggles between three different views • OverVIEW • Horizontal bars represent tasks • Colors represent different instrumented subroutines • White space indicates task is blocked waiting to complete send or receive • XX pattern indicates time spent writing AIMS trace files to disk • Lines between bars represent messages transmitted between taSks • Use keystroke and click combinations to get more information
Timeline Display (cont.) • I/OverVIEW • Colored bars indicate read, write, seek, etc. • Height of bar represents size of message • MsgVIEW • Idle time shown with two colors, one for send idling and one for receive idling • Time spent computing shown as white space • Message lines • Height of bar represents message size
Spokes View • blue - idle receive • green - busy • yellow - idle send • hatched - flushing
Controlling Scale and Speed of Playback • No scrolling or zooming capabilities • Set jump factor between 0 and 1 to speed up animation • Set pause times or breakpoints to slow down animation • Set scale to view larger or smaller time interval (default is 100 milliseconds)
tally • Processes trace file to produce resource utilization statistics on node-by-node and routine-by-routine basis • tally output can be input to statistical drawing packages such as Excel or WingZ
tally [options] [sorted tracefile] where options include:
tally output - tally.summary • Information for each procedure/function: • busy time: time spent performing useful work • global blocking: time spent in global blocking operation • send blocking: time spent in send operation • receive blocking: time spent in receive operation • life time: exclusive time • percentage communication: percentage of total execution time spent in communication • communication index: time spent in routine with respect to total time of program, as well as percentage of time spent in communication in this routine
tally.summary (cont.) • Information for each node (and routine): • busy time • global blocking • send blocking • recv blocking • percentage communication
tally output - ncpu.summary • NCPU for a given subroutine and a given k is the amount of CPU time used by that subroutine when k processors are busy, divided by k. • Routine Concurrency - amount of time spent by each subroutine when k copies were executing simultaneously (indicates degree to which each routine was parallelized)