Download

1 / 12
120 likes | 280 Views
MOD 5:. Valuation Using Cash Flows. Lauren Walaszczyk. Quick Background. Headquarter: Tokyo, Japan IFRS Accounting Products (enterprise activities) New/Used Cars Motorcycles Boats Financial Services Brands Acura

E N D
MOD 5: Valuation Using Cash Flows Lauren Walaszczyk
Quick Background • Headquarter: Tokyo, Japan • IFRS Accounting • Products (enterprise activities) • New/Used Cars • Motorcycles • Boats • Financial Services • Brands • Acura • America generates the most revenue and manufactures the highest volume of cars
Internal Strengths: • Diversified products • Large amount of R&D • Brand recognition • Large market share in Asia and America • Positive Financials • Opportunities: • Growing global demand • Depreciating Yen • New models • Demand for motorcycles • Offer low interest rates • Customer retention • Threats: • High competition • Strict emission laws and safety regulations • Sales dependent on disposable income and gas prices • Rising raw material costs • Appreciating Yen • Natural disasters: Japan earthquake and Thailand flood • Internal Weaknesses: • Product recalls • Weak market share in Europe
Breaking Apart RNEA • RNEA = EPM * EATO • 2012 EPM is low due to the natural disasters
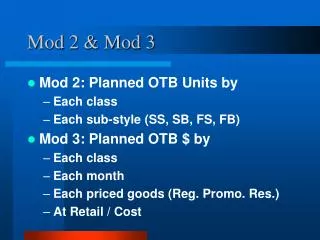
Parsimonious - Revenues • Growth assumption = 4 % • Steps: • Average the sales growth 5.8 % • Analysts opinion 2.4 % • Averaged 5.8 % and 2.4 % • The average sales growth rate high due to the jump in 2013
Parsimonious – EPM (from sales) • EPM from sales is more stable • EPM from sales shows that the enterprise operations are consistently profitable • Assume 6 % • Steps: • Average of EPM 2.65 % • Average EPM from sales 8.9 % • Averaged the two EPMs • Honda is always in the top 2 EPMs among competitors
Parsimonious - EATO • Assume 1.3 • Most comparable in Toyota • Remain stable • Seems efficient compared to most of the companies
Parsimonious Assumptions • Sales growth rate 4 % • Enterprise Profit Margin (EPM) 6 % • Enterprise Asset Turnover (EATO) 1.3
Free Cash Flows • FCF = EPAT - NEA
Discounting Cash Flows • Discount rate of 10% • Grew 2017 forward one year (2018) to start the infinite stream