Download
1 / 33
330 likes | 455 Views
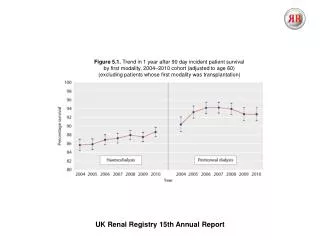
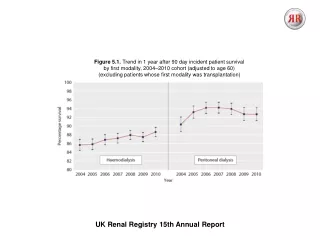
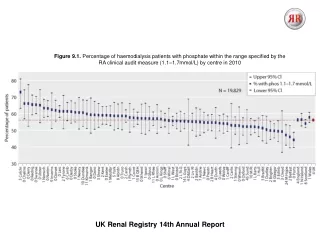
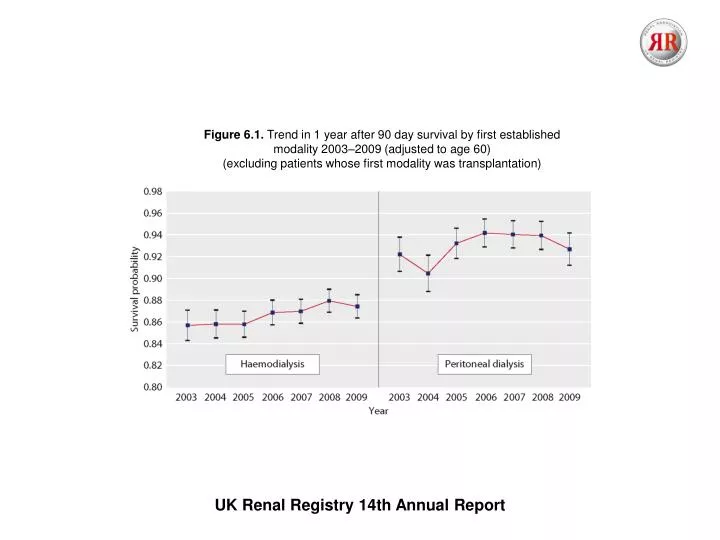
Figure 6.1. Trend in 1 year after 90 day survival by first established modality 2003–2009 (adjusted to age 60) (excluding patients whose first modality was transplantation). UK Renal Registry 14th Annual Report.

E N D
Figure 6.1. Trend in 1 year after 90 day survival by first established modality 2003–2009 (adjusted to age 60) (excluding patients whose first modality was transplantation) UK Renal Registry 14th Annual Report
Figure 6.2. Unadjusted survival of all incident patients by age group, 2009 cohort UK Renal Registry 14th Annual Report
Figure 6.3. One year after 90 days death rate per 1,000 patients years by UK country and age group for incident patients, 2006–2009 cohort UK Renal Registry 14th Annual Report
Figure 6.4. Kaplan–Meier survival of incident patients 1997–2009 cohort (from day 0), without censoring at transplantation UK Renal Registry 14th Annual Report
Figure 6.5. Kaplan–Meier survival of incident patients 1997–2009 cohort (from day 90), without censoring at transplantation UK Renal Registry 14th Annual Report
Figure 6.6. First year monthly hazard of death, by age group 1997–2009 combined incident cohort UK Renal Registry 14th Annual Report
Figure 6.7. One-year incident death rate per 1,000 patient years by age group UK Renal Registry 14th Annual Report
Figure 6.8. Change in KM long term survival by year of starting RRT, for incident patients aged 18–64 years UK Renal Registry 14th Annual Report
Figure 6.9. Change in KM long term survival by year of starting RRT, for incident patients aged ≥65 years UK Renal Registry 14th Annual Report
Figure 6.10. Long term survival of incident patients by gender, 2000–2007 combined incident cohort, adjusted to age 60 UK Renal Registry 14th Annual Report
Figure 6.11. Six monthly hazard of death, by vintage and age group, 1997–2009 incident cohort after day 90 (not censored at transplantation) UK Renal Registry 14th Annual Report
Figure 6.12. Six monthly hazard of death, by vintage and age group, 1997–2009 nondiabetic incident cohort after day 90 (not censored at transplantation) UK Renal Registry 14th Annual Report
Figure 6.13. Six monthly hazard of death, by vintage and age group, 1997–2009 diabetic incident cohort after day 90 (not censored at transplantation) UK Renal Registry 14th Annual Report
Figure 6.14. Change in one-year after 90 day incident survival, 1999–2009 (adjusted to age 60) UK Renal Registry 14th Annual Report
Figure 6.15. Survival one-year after 90 days, adjusted to age 60, 2009 incident cohort UK Renal Registry 14th Annual Report
Figure 6.16. Funnel plot for age adjusted 1 year after 90 days survival, 2006–2009 incident cohort UK Renal Registry 14th Annual Report
Figure 6.17. The effect on survival after sequential adjustment for age, PRD and comorbidity, 2005–2009 cohort UK Renal Registry 14th Annual Report
Figure 6.18. Survival at 90 days for incident diabetic and non-diabetic patients by age group in 2009 UK Renal Registry 14th Annual Report
Figure 6.19. Survival at 1 year after 90 days for incident diabetic and non-diabetic patients by age group in 2009 UK Renal Registry 14th Annual Report
Figure 6.20. Long term survival for incident diabetic and non-diabetic patients by age group, cohort 2000–2007, followed up for a minimum of 3 years UK Renal Registry 14th Annual Report
Figure 6.21. One year survival of prevalent dialysis patients in different age groups, 2010 UK Renal Registry 14th Annual Report
Figure 6.22. One year survival of prevalent dialysis patients aged under 65 in each centre, 2010 UK Renal Registry 14th Annual Report
Figure 6.23. One year survival of prevalent dialysis patients aged 65 years and over in each centre, 2010 UK Renal Registry 14th Annual Report
Figure 6.24. One year survival of prevalent dialysis patients in each centre adjusted to age 60, 2010 UK Renal Registry 14th Annual Report
Figure 6.25. One year funnel plot of prevalent dialysis patients in each centre adjusted to age 60, 2010 UK Renal Registry 14th Annual Report
Figure 6.26. One year death rate per 1,000 patient years by UK country and age group for prevalent dialysis patients UK Renal Registry 14th Annual Report
Figure 6.27. Serial 1 year survival for prevalent dialysis patients by UK country from 2000–2010 adjusted to age 60 UK Renal Registry 14th Annual Report
Figure 6.28. Relative risk of death in all prevalent RRT patients in 2010 compared with the UK general population in 2010 UK Renal Registry 14th Annual Report
Figure 6.29. Percentage contribution to cause of death for prevalent dialysis patients in 2010 UK Renal Registry 14th Annual Report
Figure 6.30. Percentage contribution to cause of death for prevalent transplant patients in 2010 UK Renal Registry 14th Annual Report
Figure 6.31. Cause of death in prevalent RRT patients by year UK Renal Registry 14th Annual Report
Figure 6.32. Median life expectancy on RRT by age group, incident patients starting RRT from 2000–2007 UK Renal Registry 14th Annual Report
Figure 6.33. Median life expectancy on RRT by age group, incident diabetic patients starting RRT from 2000–2007 UK Renal Registry 14th Annual Report