Download
1 / 23
230 likes | 326 Views
BENTHIC MACROINVERTEBRATE AND PERIPHYTON MONITORING IN THE SUWANNEE RIVER BASIN IN FLORIDA 3: SPATIAL AND TEMPORAL TRENDS. Objectives. Spatial Trends Temporal Trends Benthic Macroinvertebrates Periphyton Water Quality. Best Available Data 1989 - 2003. Hester-Dendy sampler.

E N D
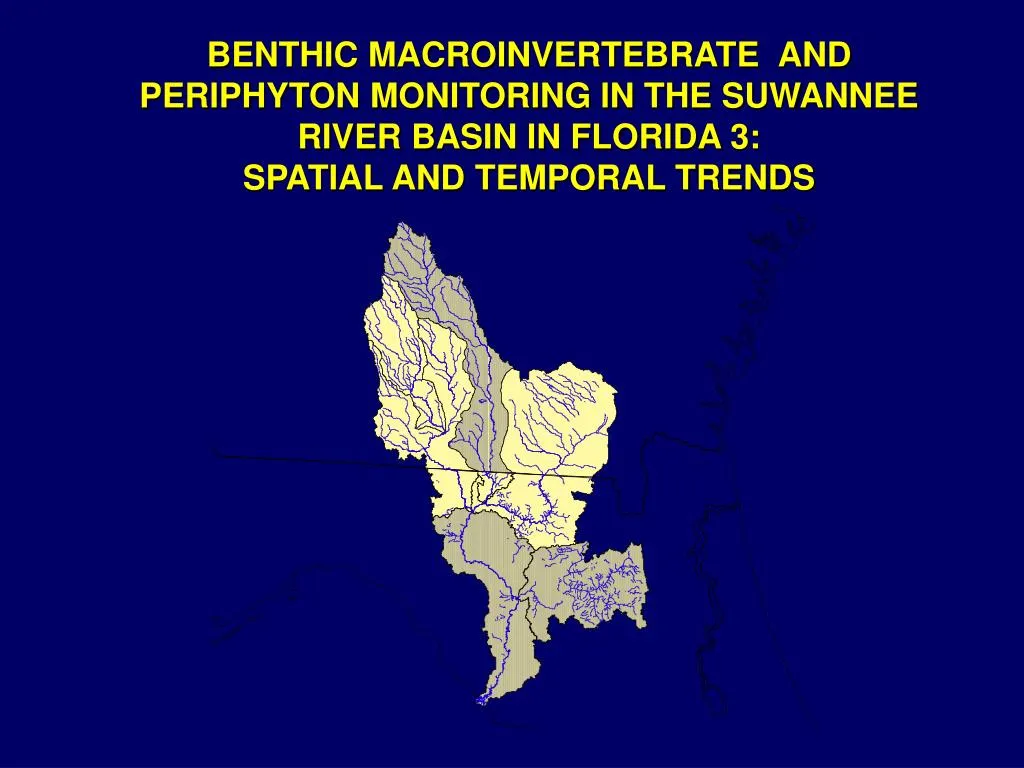
BENTHIC MACROINVERTEBRATE AND PERIPHYTON MONITORING IN THE SUWANNEE RIVER BASIN IN FLORIDA 3: SPATIAL AND TEMPORAL TRENDS
Objectives • Spatial Trends Temporal Trends Benthic Macroinvertebrates Periphyton Water Quality
Best Available Data 1989 - 2003 Hester-Dendy sampler Periphytometer
Application • Expand knowledge on ecological forcing factors (e.g., eutrophication) Provide supporting information for habitat control points for MFLs Define temporal baselines for MFLs
Spatial Trends • Principal Component Analysis to display multi-dimensional data in 2 dimensions
PCA Results • Principal Component Analysis
PCA Results Factor 1 + Ablabesmyia ramphe (.35) + Tribelos fusicorne (.31) + Slavina appendiculata (.25)Factor 2 - Stenonema exiguum (.32) + Hydropsyche rossi (.31) + Corydalus cornutus (.28)
Upper Santa Fe Lower Santa Fe With Factor 1 Upper Suwannee Lower Suwannee Factor 2
Seasonal Kendall-Tau TrendsPowerful - remove seasonal effects - adjust p values for autocorrelationQuantitative - estimate rates of changeRobust - non-parametric - meta-analysis
SUW010 SUW100 SUW130 SUW150 SRWMD • Water quality sites • Wq / biology sites • Inactive biology sites SUW240
010 Species Richness 100 130 150 240
010 Abundance 65 / yr 100 68 / yr 130 220 / yr 150 140 / yr 240 38 / yr
2003 1994
010 Conductivity (umhos/cm) 40 - 400 100 19 / yr 130 26 / yr 150 18 / yr 240 12 / yr
010 Alkalinity (mg/L) 40 - 400 0.3 / yr 100 130 8 / yr 150 7 / yr 240 5 / yr
010 Color (PCU) 0 - 500 100 34 / yr 130 33 / yr 150 30 / yr 240 18 / yr
010 TSS (mg/L) 0 - 10 0.5 / yr 100 0.8 / yr 130 0.8 / yr 150 0.5 / yr 240 0.7 / yr
010 DO (mg/L) 4 - 10 100 130 150 0.3 / yr 240
010 NO2 + NO3 (mg/L) 0 – 1.2 100 130 0.07 / yr 150 0.09 / yr 240
010 Total P (mg/L) 0 – 0.8 100 0.02 / yr 130 0.02 / yr 150 0.02 / yr 240
Bottom Line • Expand knowledge on ecological forcing factors (e.g., eutrophication) Provide supporting information for habitat control points for MFLs Define temporal baselines for MFLs