Download
1 / 10
100 likes | 328 Views
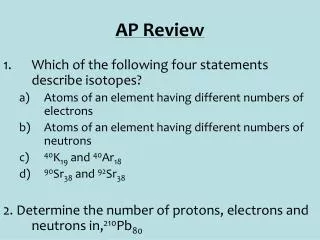
AP Review #5. Focus Chi-Square Tests Linear Regression T-Tests Reading computer printouts. There are 3 types of Chi-Square tests : Goodness of Fit tests (1 way table) Tests of Homogeneity (2-way tables with 2 or more different samples) Tests of Independence (2-way tables done by 1 sample)

E N D
AP Review #5 Focus • Chi-Square Tests • Linear Regression T-Tests • Reading computer printouts
There are 3 types of Chi-Square tests: • Goodness of Fit tests (1 way table) • Tests of Homogeneity (2-way tables with 2 or more different samples) • Tests of Independence (2-way tables done by 1 sample) • Conditions needed for Chi-Square tests: • Data must be counts (not %’s) • Data must be independent • SRS • All expected Counts must be 5
Goodness of Fit Tests 1 Way table Degrees of Freedom = Number of categories – 1 Expected Counts are found by taking the expected percentage of the table total. Null Hypothesis is that the outcome follows the expected distribution and the alternative hypothesis is that it doesn’t follow the expected distribution. Put these into context! Ex: Does the data follow the expected production of 15% Blue, 28% Red, and the rest yellow?
Tests for Independence and Homogeneity The process is the same for both tests, just the hypothesis are different. In a test for Independence, the null hypothesis is that the 2 variables are independent of each other. Put into Context! In a test for Homogeneity, the null hypothesis is that the distributions for each sample are the same. Put into context!
Calculations for Tests for Independence and Homogeneity DF = (r – 1 )( c – 1 ) Expected Counts are found by: (row total)(column total) table total Note: Use the matrix menu (edit) to enter your observed outcomes into matrix A and do the ҳ²-test. Your expected counts will be put into matrix B along with all the calculations being done for you.
Example 2: Are the distributions for employment equal? Employment Field
Linear Regression T-Tests Ho: β = 0 (There is not a linear relationship between x and y) Put into context! Ha: β ≠ (< or >) 0 (There is a linear relationship between x and y) Df = number of points – 2 Se = standard deviation of the residuals (found by doing linregttest on calc) Sx = standard devation of the x-coordinates. (found by doing 1-var stats)
Conditions for Linear Regression T-Tests • Data is somewhat linear (look at scatterplot) • Independence • Constant Variance (Look at the residual plot) • Residuals nearly normal (histogram of residuals) Confidence Interval for the True Slope of a line:
Most Importantly, you must be able to read a computer printout! Dependent variable is: date R-squared = 8.6% S = 5.747 with 84 – 2 = 82 degrees of freedom Variable Coeff SE(Coeff) t-ratio P-value Intercept 128.753 1.638 78.6 <.0001 Year -0.071960.0259 -2.78 .0067 r² a b SEb