Download
1 / 33
340 likes | 762 Views
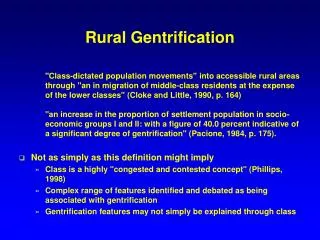
GENTRIFICATION AND GROWTH MANAGEMENT IN SEATTLE, 1990-2000. Richard Morrill Geography University of Washington January, 2003. Richard Morrill Geography, University of Washington Introduction

E N D
GENTRIFICATION AND GROWTH MANAGEMENT IN SEATTLE, 1990-2000 Richard Morrill Geography University of Washington January, 2003
Richard Morrill Geography, University of Washington Introduction My purpose is to use a set of maps of demographic change to depict gentrification and displacement within the city of Seattle, 1990-2000 Background The city experienced moderate population and job growth. Expansion of the information and technology sectors fueled city growth. Seattle changed from a relatively egalitarian city in 1970 to one of startling income inequality. GENTRIFICATION AND GROWTH MANAGEMENT IN SEATTLE, 1990-2000
Higher returns to education were critical in encouraging gentrification– that is, rising income, reinvestment in better housing, and displacement. Growth Management constrained growth on the fringe, enabling the city of Seattle to intensify and densify both jobs and housing. Scope Even though much of the displacement of the poor was to southern suburbs in King county, only the city of Seattle will be studied. Seattle is one jurisdiction and fully built, so the effect of redevelopment can be easily seen.
Data include both 100% population data and sample data, including occupation, income and poverty. Most maps will be of 1990-2000 change. Seattle versus the suburbs For perspective here is a little information on how gentrification in Seattle has displaced the less successful to the suburbs. Change in minority share Seattle Suburban King 5.3% 12.1% Change in share 25-64 5.8% -.1 % Change in med house value 88% 66 % Change in husb-wife families -1.9% -5.7% Change in college grad share 9.3 % 5.0% Change in prof. occup share 11.6% 7.7% Change in share of poor -.6 %` 1.2%
What these differences tell us about gentrification and displacement. Greater increase in share of minorities in the suburbs Greater increase in share of workers 25-64 in the city Greater decline of husband-wife families in the suburbs Greater increase of median house value and rents in the city Astoundingly high shares of college educated (47%) and of professional occupations (48%) in the city. Reduced share of the poor in the city, increased in the suburbs.
Population Change Almost all the growth in the city occurred in high density apartments and condominiums, mostly in and around downtown, where the population more than doubled.
Race and ethnicity Race is part of the gentrification story. In the far north and far south of the city, the share of whites fell moderately, and were replaced by Asians, but in the area of displacement east of downtown, white numbers grew dramatically.
The map of minority change is the obverse, and nicely depicts decline east of downtown and growth in the far north and south of the city.
Change in the Black population is a major component of gentrification. The large area of decline east and southeast of downtown is the core of the historic Black community. Aggressive white reentry and reinvestment displaced several thousand Black persons. Even public housing projects are affected, as they are rebuilt with a share of ‘market’ homes.
AGE Seattle is unusually attractive to young adults and fairly unattractive to families with children. Numbers of children under 10 are declining over most of the city, from already extremely low levels and even affects minority areas, where many families have been displaced to the south.
Change in young adults, 25-34, is totally different, and very high, despite already high numbers. They are the main constituent of growth downtown, on Capitol Hill, on Queen Anne and in areas west of the University of Washington. Many work in the engineering, information and technology firms expanding in the area.
Persons 45-64, the aging babyboomers, increased in numbers in downtowns condominiums, but more in the ring of family housing surrounding the core, and contributing to gentrification in the Ballard and Greenlake areas west of the university, and in the southeastern Seattle minority area.
The older population, over 65, declined in much of the city, often displaced by the more aggressive gentrifying 25-34 year old group
Types of Households Seattle is not a family city, and shares and numbers fell in much of the city. Small gains did occur in areas of Asian immigration in the far south, and in the downtown core, over 90% in the form of husband-wife couples without children, both young and empty-nesters.
Seattle has a very high share of singles – over 40 percent of all households. But many singles seem to have been outbid for housing downtown by double-income households, but they did contribute to gentrification and displacement east of downtown and west of the university.
Non-family households with 2 or more persons, which in Seattle are about 2/3 opposite sex and 1/3 same sex grew very rapidly over most of the city, but especially in and around downtown, in the Fremont, Ballard and Greenlake areas, where they often displaced aging families. These are the dominant agents of gentrification.
Housing Although most housing expansion in Seattle has been in the form of apartments, ownership shares increased slightly because of condominium construction and conversion. The map of ownership change highlights its role in the reinvestment and gentrification of the core.
High proportions of single family housing dominate the periphery of the historic city of Seattle, before 1955. Large scale replacement by apartments has reduced their numbers and led to price inflation, as they are attractive to both family and non-family professionals.
The areas dominated by small apartment structures (under 10 units) very much corresponds with the areas of gentrification. However, in downtown Seattle, new housing was mainly in the form of large, high-rise apartment structures.
Change in housing values may be the single best indicator of gentrification, especially areas with over a 100% appreciation. This map is quite different from one of the current values, as change in most affluent areas was modest. Four areas of gentrification include Capitol Hill (east of downtown), Beacon Hill-Rainier Valley to the SE
The northern part of West Seattle (closest to downtown) and the Fremont-Greenlake area west of the university, areas with many high-tech jobs Change in median rents show a more concentrated downtown pattern of highest rent change, often from new construction of much higher quality.
Education Change in shares with college degrees is another good indicator of gentrification. Higher shares prevail in most areas of gentrification, far to the west of the UW, and in West Seattle and the southeast from low to moderate levels, and in Greenlake and Queen Anne from already high levels.
Occupation Areas with the greatest increase in shares of professional occupations almost perfectly correspond with areas of gentrification: downtown, on Capitol Hill, southeast along Lake Washington, in West Seattle, and in Fremont and Greenlake.
Income, poverty and inequality. Change in Median household Income No surprise here! Areas of greater gain in income are the gentrifying areas in and around downtown, west of the UW and southeast along Lake Washington, while already affluent, less professional parts of the city had little change.
Change in the percent poor is a good indicator of the displacement effect of gentrification, evident mainly downtown and in areas of minority displacement to the east and southeast. Poverty rates increased in areas of recent Asian immigration in the far north and far south of the city.
Income inequality, a measure of the gap between mean and median household incomes, increased markedly in Seattle from 1980 to 2000. It is not surprisingly high in areas with a high share of professionals, in and around downtown and the university, and far lower in both less and more affluent mainly residential parts of the city. It is high is in areas of partial displacement of Blacks southeast of downtown.
Migration The geographic pattern of migrants, those from beyond King county is highly concentrated, and a telling indicator of WHO is doing the gentrifying: not locals, but young people from other counties, states and countries, attending the university and filling hi-tech and professional jobs in the gentrifying areas.
Change in the percent foreign born has a very different geography. There is a downtown-Capitol Hill and Queen Anne cluster, more professional, but more dominant are areas of recent immigration of Asian (and Hispanic) families to the far north and especially the far south of the city.
Place of work The maps of change in Seattle persons working in the city or in the suburbs reveals an intriguing division: higher shares staying in the city occur in gentrifying areas west of the university, as the workforce shifts toward the professions.
But on prestigious Capitol Hill and high tech areas around Lake Union, higher numbers like to live in the urbane core, while working in the suburbs (Microsoft, et al), leading to a broad equivalence in the rush hour east and westbound commutes.
The final map shows persons using public transit– yes the highest shares are indeed in the core gentrifying areas, as well as in less affluent minority areas (often core service workers who can’t afford to live there).
Summary and conclusion Gentrification is real Population, income, housing, jobs, education and race Agents of gentrification Geography of gentrification Reinvestment and displacement Why did this occur? High tech information economy Natural environment and recreation Social environment and tolerance Revitalization of downtown The Planning context Growth Management The New urbanist ideal Market and planning in sync
References • Bourne, L (1993) The demise of gentrification. Urban Geography, 14, 95-107 • Hodge, D (1979) The Seattle Displacement Study. Seattle. Office of Planning • Hodge, D (1981) Residential revitalization in a growth region, Geographical Review, 71, 188-200 • Hodge, D and Lee, B (1981) Spatial differences in displacement rates in US cities, Urban Studies, 21, 219-231 • Ley, D (1996) The new middle class and the remaking of the central city. Oxford University Press. • Smith, N (1992) Gentrification and uneven development. Economic Geography, 58, 139-155 • Smith, N (1996) The new urban frontier: gentrification and the revanchist city. New York: Routledge