Download
1 / 16
160 likes | 290 Views
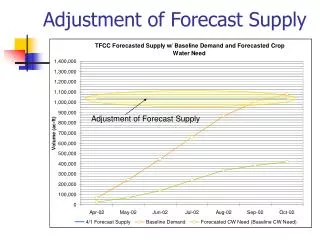
Research Grants GR/60181/01 and GR/60198/01. Analysing Forecast Adjustment Behaviour. Michael Lawrence UNSW, Sydney, Australia Robert Fildes University of Lancaster, UK Paul Goodwin University of Bath UK. An EPSRC Research Project

E N D
Research Grants GR/60181/01 and GR/60198/01 Analysing Forecast Adjustment Behaviour Michael Lawrence UNSW, Sydney, Australia Robert Fildes University of Lancaster, UK Paul Goodwin University of Bath UK An EPSRC Research Project A collaboration between Lancaster Centre for Forecasting,, and 10+ companies, including McBride, Interbrew, Heinz
Promotion: 2 for 1 Economic factors Customers £ Sales EPOS info Retailer Orders Shipments Manufacturer Information affecting the supply chain Forecast object The basic model: Forecast of Orders = f(past orders) + judgemental estimates of promotions etc. = computer forecast + judgemental adjustment
Background theory • Influence of biases and heuristics • Tversky and Kahneman – Many lab & field studies • Anchor and adjustment heuristic implies anchoring on the statistical forecast and a too small adjustment • Lawrence and O’Connor – Lab studies • In time series forecasting adjustment generally too small not too large. • Hypothesis: Adjustment too big so biased high (up adjust) or low (down adjust).
Mathews & Diamantopolous • Studied large warehouse operation where forecasts routinely adjusted. Found adjustments beneficial (altho often only marginal) but biased. • Lawrence, O’Connor and Edmundson • Studied forecasting practice in 13 large multinationals all using only judgement. • Forecasts biased and inefficient – some organisations worse accuracy than naïve forecast, others good. • Optimism Bias • Most widely studied and observed bias • Benefits overestimated and costs underestimated. • Hypothesis: Positive benefits (e.g. promotion) over-estimated negative impacts underestimated. • Forecasts biased and inefficient.
Analysis Methodology • Analyse by up and down adjustments • Error measures • Absolute Percentage Error: • APE = |act – fcst|/act • Forecast improvement: • FCIMP = (|act - systfc| - |act – finalfc|)/act • Note: When FCIMP is +ve adjustment has improved the forecast. • Measures of adjustment impact on accuracy • 1. Comparison of median PE’s and APE’s • 2. Forecast improvement - FCIMP
Analysis Methodology 3. Validity of decision to adjust. • Conjectured steps in adjustment. (From observations of currency forecasting.) • (a) Decide if statistical computer forecast is too low or too high. • This results in a decision to adjust and a direction for the adjustment. • (b) Decide by how much to adjust the forecast. • Hence most basic adjustment measure: • How often is the direction for the adjustment correct? • Pool companies A-C as statistical properties similar.
Observations • System forecasts much better than naïve and so form good anchor point for adjustments. • Overall, the groups selected for adjustment need it (indicated by bias of system forecast. • UP adjustments biased and make little difference to accuracy. (validated by t-test) • DOWN adjustments unbiased and make considerable improvement to accuracy.
What percent of adjustments are in the right or wrong direction?
Why is wrong direction picked so often? • Alternatives: • 1. No valid basis for adjustment – just an “illusion of control” affect. (Note that if the direction is picked at random, 50% will be wrong.) • 2. Timing effect. E.g. influence of promotion anticipated too soon. • Assume timing effect (or possibly learning effect?): If an adjustment is made in the period following a wrong sided adjustment, it should be more accurate.
% WRONG FCIMP 45% WRONG -4.0% __ __ 33% WRONG +2.2% Wrong up adjustment (34%) 53% UP 17% NO 30% DOWN Period t t+1 After a wrong sided adjustment the accuracy of judgement is worse.
% WRONG FCIMP 39% -0.13% _ _ 36% +1.6% 35% UP Wrong down adjustment (29%) 13%NO 51% DOWN Period t t+1
Conclusions on wrong direction. • In period following a wrong adjustment: • Over 80% of forecasts adjusted • An UP adjustment worsens forecast. • A DOWN adjustment improves forecast. • Direction error rates generally show increase. • Timing effect does not appear responsible for wrong direction. • Illusion of control seems best explanation for increasing error rates on adjustment. • Evidence for optimism bias. • After two wrong adjustments the following period shows a similar pattern.
How to improve adjustments • Incorporate restrictiveness, guidance and better feedback into software • Prevent small adjustments to system forecasts. • Prevent an UP adjustment following a wrong sided adjustment unless special reason is given. • Provide systematic feedback on results of adjustment activity. • Schedule periodic meetings to review impact of adjustments on accuracy and chart progress. • While the software can play a role, the major changes needed are organisational.