Download
1 / 63
630 likes | 758 Views
Level of Service and Design Traffic Volumes. CEE 320 Kelly Pitera. Outline. Freeway Segment LOS Determination Free-flow speed Flow Rate Multilane Highway LOS Design Traffic Volume. Freeway LOS. Freeway LOS. LOS Calculation. Does not consider

E N D
Level of Service and Design Traffic Volumes CEE 320Kelly Pitera
Outline • Freeway Segment LOS Determination • Free-flow speed • Flow Rate • Multilane Highway LOS • Design Traffic Volume
Freeway LOS LOS Calculation • Does not consider • Special lanes reserved for a particular type of vehicle (HOV, truck, climbing, etc.) • Extended bridge and tunnel segments • Segments near a toll plaza • Facilities with FFS < 55 mi/h or > 75 mi/h • Demand conditions in excess of capacity • Influence of downstream blockages or queuing • Posted speed limit • Extent of police enforcement • Intelligent transportation system features • Capacity-enhancing effects of ramp metering
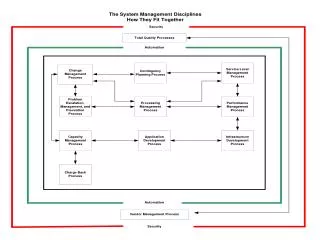
Freeway LOS Input Geometric Data Measured FFS or BFFS Volume (highest) BFFS Input If FFS not known BFFS Adjustment Lane width Number of lanes Interchange density Lateral clearance Volume Adjustment PHF Number of lanes Driver population Heavy vehicles Adjust for temporal variation Measured FFS Input Compute FFS Compute flow rate Determine S from speed-flow curve Compute density using flow rate and speed Determine LOS Check on speed-flow curve
Freeway LOS Determining FFS • Measure FFS in the field • Low to moderate traffic conditions • Use a baseline and adjust it (BFFS)
Base conditions for basic freeway segment • 12-ft lane widths • 6-ft right shoulder • 2-ft median lateral clearance • Only passenger cars • 5 or more lanes in each travel direction • 2-mi or greater interchange spacing • Level terrain • Mostly familiar roadway users
Freeway LOS Lane Width Adjustment (fLW) • Base condition (fLW = 0) • Average width of 12 ft. or wider across all lanes • Table 6.3 in text From Highway Capacity Manual, 2000
Freeway LOS Lateral Clearance Adjustment (fLC) • Base condition (fLC = 0) • 6 ft. or greater on right side • 2 ft. or greater on the median or left side • Table 6.4 in text From Highway Capacity Manual, 2000
Freeway LOS Number of Lanes Adjustment (fN) • Base condition (fN = 0) • 5 or more lanes in one direction • Do not include HOV lanes • fN = 0 for all rural freeway segments • Table 6.5 in text From Highway Capacity Manual, 2000
Freeway LOS Interchange Density Adjustment (fID) • Base condition (fID = 0) • 0.5 interchanges per mile (2-mile spacing) • Interchange defined as having at least one on-ramp • Determined over 6-mile segment • Table 6.6 in text From Highway Capacity Manual, 2000
Freeway LOS Determining FFS • Use a baseline and adjust it (BFFS)
Freeway LOS Input Geometric Data Measured FFS or BFFS Volume (highest) BFFS Input If FFS not known BFFS Adjustment Lane width Number of lanes Interchange density Lateral clearance Volume Adjustment PHF Number of lanes Driver population Heavy vehicles Adjust for temporal variation Measured FFS Input Compute FFS Compute flow rate Determine S from speed-flow curve Compute density using flow rate and speed Determine LOS Check on speed-flow curve
Freeway LOS Determining Analysis Flow Rate • Adjust hourly volumes to get pc/ln/hr
Freeway LOS Peak Hour Factor (PHF) • Typical values • 0.80 to 0.95 • Lower PHF characteristic of rural or off-peak • Higher PHF typical of urban peak-hour
Freeway LOS Heavy Vehicle Adjustment (fHV) • Base condition (fHV = 1.0) • No heavy vehicles • Heavy vehicle = trucks, buses, RVs • Two-step process • Determine passenger-car equivalents (ET, ER) for this traffic stream • Determine fHV
Freeway LOS Passenger-Car Equivalents (ET,ER) • Extended segments method • Determine the type of terrain and select ET,ER • Level, rolling, mountainous • No one grade of 3% or more is longer than 0.25 miles OR • No one grade of less than 3% is longer than 0.5 miles • Table 6.7 in text From Highway Capacity Manual, 2000
Freeway LOS Passenger-Car Equivalents (ET) • Specific grades method • Any grade of 3% or more that is longer than 0.25 miles OR • Any grade of less than 3% that is longer than 0.5 miles From Highway Capacity Manual, 2000
Freeway LOS From Highway Capacity Manual, 2000
Freeway LOS Passenger-Car Equivalents (ER)
Freeway LOS Passenger-Car Equivalents (ET,ER) • Composite grades method • Determines the effect of a series of steep grades in succession • Distance weighted average • Method OK if… • All subsection grades are less than 4% OR • Total length of composite grade is less than 4000 ft. • Otherwise, use a detailed technique in the Highway Capacity Manual (HCM) From Highway Capacity Manual, 2000
Freeway LOS Determine fHV
Freeway LOS Driver Population Adjustment (fP) • Base condition (fP = 1.0) • Most drivers are familiar with the route • Commuter drivers • Typical values between 0.85 and 1.00 • Analyst selects the value using judgement • Dependent on local conditions (scenic views, etc.)
Freeway LOS Determining Analysis Flow Rate • Adjust hourly volumes to get pc/ln/hr
Freeway LOS Input Geometric Data Measured FFS or BFFS Volume (highest) BFFS Input If FFS not known BFFS Adjustment Lane width Number of lanes Interchange density Lateral clearance Volume Adjustment PHF Number of lanes Driver population Heavy vehicles Adjust for temporal variation Measured FFS Input Compute FFS Compute flow rate Determine S from speed-flow curve Compute density using flow rate and speed Determine LOS Check on speed-flow curve
Freeway LOS Define Speed-Flow Curve Select a Speed-Flow curve based on FFS From Highway Capacity Manual, 2000
Freeway LOS Determine Average PC Speed (S) For 70 < FFS ≤ 75 mph AND (3400 – 30FFS) < vp ≤ 2400 For 55 < FFS ≤ 70 mph AND (3400 – 30FFS) < vp ≤ (1700 + 10FFS) For 55 < FFS ≤ 75 mph AND vp < (3400 – 30FFS)
Freeway LOS Input Geometric Data Measured FFS or BFFS Volume (highest) BFFS Input If FFS not known BFFS Adjustment Lane width Number of lanes Interchange density Lateral clearance Volume Adjustment PHF Number of lanes Driver population Heavy vehicles Adjust for temporal variation Measured FFS Input Compute FFS Compute flow rate Determine S from speed-flow curve Compute density using flow rate and speed Determine LOS Check on speed-flow curve
Freeway LOS Determine Density • Calculate density using:
Freeway LOS DetermineLOS LOS Criteria for Basic Freeway Segments From Highway Capacity Manual, 2000
Freeway LOS Define Speed-Flow Curve Select a Speed-Flow curve based on FFS From Highway Capacity Manual, 2000
Geometry 11 ft. lane width 2 lanes Left lateral clearance = 5 ft. Right lateral clearance = 4 ft. Other SR 520 7 am PHF = 0.95 2% trucks 3% buses Freeway LOS Example Determine the typical LOS for a 6 mile stretch of roadway with 5 interchanges. Determine free flow speed, analysis flow rate
Freeway LOS Determine FFS (fLW) • FFS = BFFS – fLW – fLC – fN – fID • BFFS is 70 mph for urban freeway • Given 11 ft lanes • fLW = 1.9
Freeway LOS Determine FFS (fLC ) • FFS = BFFS – fLW – fLC – fN – fID • Given 2 lanes, 4ft right clr • fLC = 1.2
Freeway LOS Determine FFS (fN) • FFS = BFFS – fLW – fLC – fN – fID • Given: 2 lanes • fN = 4.5
Freeway LOS Determine FFS (fID) • FFS = BFFS – fLW – fLC – fN – fID • fID = 2.1 In a 6-mile stretch there are 5 interchanges 5/6=.833 Linear interpolation: (1-.75)/(1-0.833)=(2.5-1.3)/(2.5-x); x = 2.05
Determine FFS • FFS = BFFS – fLW – fLC – fN – fID • FFS = 70 – 1.9 – 1.2 – 4.5 – 2.1 = 60.3 mph
Geometry 11 ft. lane width 2 lanes Left lateral clearance = 5 ft. Right lateral clearance = 4 ft. Other SR 520 7 am PHF = 0.95 2% trucks 3% buses Freeway LOS Example Determine the typical LOS the a 6 mile stretch of roadway with 5 interchanges. FFS = 60.3 mph
Freeway LOS Determine Flow Rate (V) At 7am the ½ hour volume is about 4000 veh/hrAssume half in each direction, 4000 veh/hr max Graph from the Puget Sound Regional Council’s Puget Sound Trends, No. T6, July 1997
Freeway LOS Determine Flow Rate (vp) • ET = 1.5, ER = 1.2 • Assume there are no RVs • fHV = 1/(1+PT(ET-1) + PR(ER-1) • fHV = 1/(1+0.05(1.5-1) + 0(1.2-1) = 0.9756 • Assume commuters, therefore fP = 1.00 • Vp = V/ (PHF*N*fHV*fP) • Vp = 4000 vph / (0.95)(2)(0.9756)(1.00) = 2158 pcplph
Freeway LOS Determine LOS FFS = 60 mph, Vp = 2158 pcplph, S = about 56 mph, Looks like LOS E, Density = 2158/56 = 39 pc/mi/ln
Freeway LOS LOS Criteria for Basic Freeway Segments From Highway Capacity Manual, 2000
Multilane Highway LOS Multilane Highway LOS • Similar to Freeway LOS • A few minor differences
Multilane Highway LOS Free Flow Speed (FFS) • Measure FFS in the field • Low to moderate traffic conditions • Use a baseline and adjust it (BFFS)
Multilane Highway LOS Base Conditions for Multilane Highway • Level terrain, with grades no greater than 2 percent • Minimum lane width = 12 ft • Objects no closer than 6 ft from the edge of the traveled pavement (at the roadside or median) • No direct access points along the roadway • Divided highway • Traffic stream composed entirely of passenger cars • Free flow speed of 60 mph or more • Driver population composed principally of regular users
Multilane Highway LOS Lane Width Adjustment (fLW) • Base condition (fLW = 0) • Average width of 12 ft. or wider across all lanes Same as Freeway LOS From Highway Capacity Manual, 2000
Multilane Highway LOS Lateral Clearance Adjustment (fLC) • Base condition (fLC = 0) • 12 ft or greater TLC • LCL = 6 ft for undivided highways • (accounted for in median type adjustment) • LCL = 6 ft for two-way left-turn lanes From Highway Capacity Manual, 2000
Multilane Highway LOS Median Adjustment (fM) • Base condition (fM = 0) • Divided highway From Highway Capacity Manual, 2000
Multilane Highway LOS Access-Point Density Adjustment (fA) • For each access point/mi FFS decreases by 0.25 mph • Base condition (fA = 0) • 0 access points per mile • For NAPM ≤ 40: fA = 0.25 × NAPM • For NAPM > 40: fA = 10 From Highway Capacity Manual, 2000