Download
1 / 10
100 likes | 161 Views
TechFit Group 2. Framework development. Collect context measures to link to technology attributes – find the link between decision steps 1 & 2 Determined categories & measures: Land & NR base (e.g. wage/land, %grazing, tlu /ac) Labour & markets (e.g. labour/milk, % milk sold)

E N D
Framework development • Collect context measures to link to technology attributes – find the link between decision steps 1 & 2 • Determined categories & measures: • Land & NR base (e.g. wage/land, %grazing, tlu/ac) • Labour & markets (e.g. labour/milk, % milk sold) • Inputs & services (e.g. ext contacts, credit, suppliers) • Complementary technologies (%crossbred, mech.) • Capacity (e.g. schooling, mobile phones, groups) • Tradition & culture (e.g. gender, openness to change)
The village (1) • Collected data to determine context measures • Mason village near Nainbagh bazaar • N30.5662; E78.05044, 1211m • Rainfed intensive cropping • Livestock mainly dependent on grazing, cut & carry (CPR) & crop residues • Increasing labour shortage (schooling, jobs) • Improving market access • Livestock numbers (cattle) have declined • Milk sales have recently increased
The village (3) • Few key informants (well exposed) • NGO representative supported • Many quantitative measures seemed sufficiently easy to achieve (market linked) • Framing questions was critical (wheat bran feeding was initially overlooked) • Required level of detail not easy to determine (cows & buffaloes) • Difficult to follow logical thread while going through check-list
The process • What we did with what we found in the village • Collected context data validated context measure check list • Collapsed measures into scores to enable matching • Setting up our matching system • Determined correlated technology scores (land requirement, labour requirement, novelty) • Deduced that thresholds are more than matches • Found two types of scores: resources & requirements
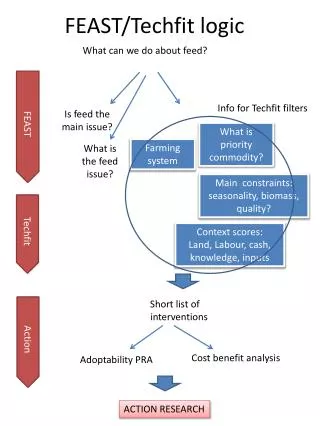
Is feed the issue? Do something else All possible feed technologies (74) Technology attribute measures (1- 74). Globally constant Location specific Context measures • Thresh hold reached? • Does context resource score equal or exceed technology requirement score? • Does technology supply score equal or exceed context requirement score Score - (Scale 1-5) Score - (Scale 1-5) Technologies ranked by fit to context (Tech FIT index) Short list of contenders (<5) Cost benefit, gender, culture Participatory social-economic assessments Assess biophysical requirements The TECH that FITs ®
Gaps • Data • Quantification of use and management of CPR • Seasonal feed composition • Bio-physical requirements of interventions (apply to short-list • Integration with Feast • Reflection on audience (Which capacity is required to collect context data and to determine scores)
Next steps • Refinement and testing of context measures • Improve the link between context attribute measures and context scores • Expand list of technologies • Improve link between technology attribute measures and technology scores