Download
1 / 38
380 likes | 513 Views
Electric Power Sector Emissions Forecast. Peter Ciborowski February 19, 2013. historic. forecast. GHG Electric Power Emission Sources. In-state Combustion fossil CO 2 , CH 4 , N 2 O Flue gas desulphurization fossil CO 2 Coal storage CH 4 Hydroelectric reservoirs CH 4

E N D
Electric Power Sector Emissions Forecast Peter Ciborowski February 19, 2013
historic forecast
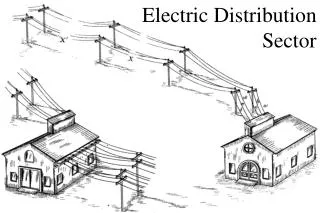
GHG Electric Power Emission Sources In-state Combustion fossil CO2, CH4, N2O Flue gas desulphurization fossil CO2 Coal storage CH4 Hydroelectric reservoirs CH4 Transmission SF6 Out-of-state Combustion fossil CO2, CH4, N2O
General Approach In-state Generation MWH MMBtu input emissions Heat rate Emission rate Fuel energy content fuel use Capacity factor capacity Out-of-state Generation MWH emissions Emission rate
Sources for Net Generation Forecast Nonrenewable generation XCEL, MP, OTP, ISP, GRE, MPC, SMMPA: 2012 MN Annual Electric Report - covers 97% of nonrenewable net generation Other (mainly municipals with associated district heating): 3-year historic average, 2009-2011 Renewable generation Existing facilities: Mostly 3-year historic average, 2009-2011 or, for reporting utilities, 2012 Annual Electric Report forecast Planned facilities: Most recent Integrated resource plans, characteristic capacity factors Further expansion under out-year RES requirements: RES requirements assessment, 40% wind capacity factor, location based on historic in-state vs out-of-state deployment
Why Minnesota Annual Electric Report Forecast? • model-based economic dispatch • internal consistency on a utility-by-utility basis between forecasted electric demand and forecasted unit dispatch and purchases • near-comprehensive coverage of GHG-emitting generation sources • ease of annual update to the forecast
RES Assessment Components • Retail sales forecast, utility by utility • % RES requirement (MN, WI, MT), utility by utility • Forecasted generation, capacity and capacity factors at existing and planned units • Unit retirements • RES requirements satisfied if: -generation from existing or planned units in any one year plus REC purchases that year minus REC sales that year plus banked RECs (4-yr shelf life) = REC retirement requirement -if not, add wind capacity in 5 MW increments until deficit disappears
RES Assessment (cont.) • Utility or utility groups with MN RES obligations: XCEL, MP, OTP, ISP, GRE, DPC, MPC, East River, L&O, MRES, Heartland, CMMPA, MMPA, SMMPA • Mandatory RES requirements affecting MN utilities: MN RES, WI RPS, MT RPS • State-specific RPS requirements: see documentation • Geographical scope for REC generation: M-RETs region • Source for retail sales forecasts, 2012-2025: 2012 MN Annual Electric Report and, for nonreporting utilities, least square fit to retail sales data, 2001-2011 • Source for RECs ownership: RES compliance filings • Future use of purchased REC purchases: none
Note: forecast line with red triangles is forecast used in this analysis
Net Imports • Net imports before losses = Retail sales minus in-state net generation • T&D losses typically 5 to 7% • 2010 Minnesota example: Retail sales 67,800 GWh In-state net genn 52,663 GWh Line loss 4,573 GWh Deficit before line loss 15,137 GWh Source: EIA, Minnesota Electricity Profile 2010 (2012)
Unit Retirements XCEL Energy: Black Dog units 3-4, Wilmarth units 1-2, Red Wing units 1-2, Key City, Granite City Minnesota Power: Sappi unit 5 Otter Tail Power: Hoot Lake units 2-3 Rochester Public Utilities: Silver Lake Austin Utilities: Austin NE: unit 1 (converson to natural gas)
Unit Additions (cumulative MW increase from 2012) • Simple cycle gas turbine: 9 MW 2013, 33 MW 2014, 132 MW 2015, 224 MW 2018 • Combined cycle gas turbine: 195 MW 2018, 390 MW 2019, 731 2020, 926 MW 2023, 1,212 MW 2024, 1,953 MW 2025 • Wind: 40 MW 2013, 53 MW 2014, 74 MW 2015, 87 MW 2016, 124 MW 2017, 292 MW 2018, 302 MW 2019, 404 MW 2020, 416 MW 2021, 892 MW 2022, 1,321 MW 2023, 1,518 MW 2024, 1,531 MW 2025
historic forecast
Forecast Historic
EIA 2013 Annual Energy Outlook MRO-west Net Generation Forecast
Conclusions • GHG emissions from the Minnesota power sector are likely to largely unchanged, 2013-2025 • Declining emissions from imports are largely offset by increasing emissions from expanded natural gas use • By the end of 2012, 70% of the emission reductions in-state that might be expected under the RES are likely to already have been realized • Electric power sector GHG emissions at 2015 will be 15% below 2005 levels, meeting the statutory target
Proposed RES Modeling Assumptions • Where not prescribed by a carve-out, wind is the technology of choice • Natural gas back-up generation to wind be calculated at 25% of wind generation • New wind capacity factors will rise to 40% by 2015 • The location of additional wind capacity (in-state, out-of-state) will follow historical patterns • Wind will displace either baseload coal or imports; the calculation should be done both ways