Download
1 / 9
100 likes | 234 Views
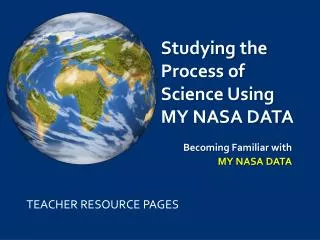
Studying the Process of Science Using MY NASA DATA Grades 6-9. Becoming Familiar with MY NASA DATA . Studying the Process of Science Using MY NASA DATA: Introduction.

E N D
Studying the Process of Science Using MY NASA DATA Grades 6-9 Becoming Familiar with MY NASA DATA
Studying the Process of Science Using MY NASA DATA: Introduction Changing climate trends are currently a “HOT” topic. There seem to be a lot of people with differing opinions as to whether or not our climate is actually undergoing drastic changes, or simply experiencing a normal shift similar to that which has been occurring throughout the life of our planet. So, how do scientists study a question of this magnitude? What types of information do they use to find answers to such a question? As you examine the MY NASA DATA Live Access Server you will examine and select data parameters (variables) that could be used by scientists to study current climate trends. Research Question: What types of information might scientists use to examine current climate trends? As you complete each task you will record the information you gather in your scientist notebook.
TASKS 1st Task: View the MND YouTube Tutorial found on the Using My NASA Data page to get an overview of the MY NASA DATA website. 2nd Task: Observe the Live Access Server to see what types of DATA are available on the MY NASA DATA site. 3rd Task: What are the sources of the data that are located on the MY NASA DATA site? Examine the DATA Sources Link and copy/complete the DATA Source Chart which is found at the end of the web quest. 4th Task: Observe the Animation: Earth’s Net Radiation Flux . What appears to be happening to the Earth’s Net Radiation? 5th Task: What pieces of DATA do you think will be most valuable as scientists examine climate trends? Select at least four different data set parameters (variables) to examine, make sure that each set covers an extended time period allowing you to look at climate patterns.
Display and print out the four different data sets with parameters you have selected to examine. Make sure that each set covers an extended time period that will provide you with enough data to look for any possible changing trends in the climate. • It might be helpful to use the Computer Tools on MY NASA DATA to assist you in making graphic representations of your data. DATA
Examine your data sets, looking for trends or patterns. • Do you see any changes occurring over time within the parameters (variables) you have selected, or are things remaining consistently the same? • What types of changes, if any, do you see occurring? • What types of relationships do you see occurring between the different variables you have selected to study? • Do you feel that you have selected data sets that c0uld be used to identify any trends that might be occurring, or do you feel that you need to collect more data at this time? • If you are confident the data you have selected can be used to identify any trends that might be occurring or sufficiently show that no real change is occurring, you are ready to move on to the conclusion of your study. Analysis
Research Question: What types of information might scientists use to examine current climate trends? • As a citizen scientist it is your responsibility to present to your audience a scientifically based conclusion derived from the data you have collected from MY NASA DATA. In your conclusion include questions for further study that have developed as a result of your current research. • Your conclusion will need to be developed into a short presentation through which you will share the results of your study. You may choose to develop a Power Point, poster, brochure, lab report or video clip to present your findings. Conclusion
Components of Presentation: • Research Question • Data Sets/Parameters Selected • Graphic Representations of your Data • Analysis of Data • Conclusion Statements • Questions for Further Study
A Student’s Guide to Climate Change:www.epa.gov/climatechange/kids/ • NICE: NASA Innovations in Climate Educationhttp://nice.larc.nasa.gov/ • Global Climate Changehttp://climate.nasa.gov/evidence Additional References: