Download
1 / 1
10 likes | 224 Views
PCA Scores of Sejet and. PCA Scores of Sejet and. Abed. Abed. cultivars. cultivars. 80. 80. A7. A7. 60. 60. A32. A32. 40. 40. A5. A5. A22. A22. A22. A18. A18. A18. S19. S19. A17. A17. A17. A97. A97. A97. S17. S17. S63. S63. A69. A69. A69. A10. A10. A10.

E N D
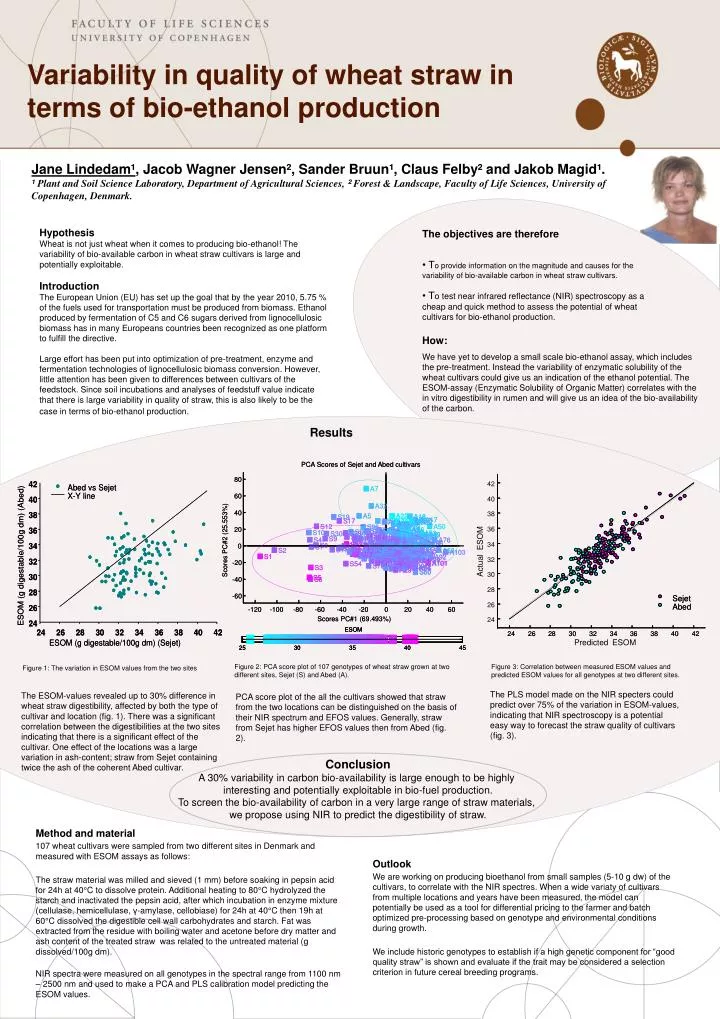
PCA Scores of Sejet and PCA Scores of Sejet and Abed Abed cultivars cultivars 80 80 A7 A7 60 60 A32 A32 40 40 A5 A5 A22 A22 A22 A18 A18 A18 S19 S19 A17 A17 A17 A97 A97 A97 S17 S17 S63 S63 A69 A69 A69 A10 A10 A10 A58 A58 A58 A12 A12 A12 A95 A95 A95 A27 A27 A27 A41 A41 A41 S12 S12 A9 A9 A9 A50 A50 S96 S96 A20 A20 A20 20 20 A13 A13 A13 A2 A2 A2 A66 A66 A66 S76 S76 S25 S25 A102 A102 A102 S94 S94 S36 S36 A79 A79 A79 S10 S10 A70 A70 A70 A16 A16 A16 S29 S29 A53 A53 A53 S30 S30 A82 A82 A82 A25 A25 A25 A71 A71 A71 A59 A59 A59 A19 A19 A19 A49 A49 A49 S27 S27 A54 A54 A54 S91 S91 A8 A8 A8 A57 A57 A57 S26 S26 S74 S74 A78 A78 A78 A51 A51 A31 A31 A31 A42 A42 A42 S28 S28 A15 A15 A15 S9 S9 A4 A4 S16 S16 S16 A52 A52 A52 A81 A81 A98 A98 A98 S4 S4 A3 A3 A3 A76 A76 Scores PC#2 (25.553%) Scores PC#2 (25.553%) A93 A93 A93 S102 S102 S102 A94 A94 A94 S69 S69 S69 S72 S72 S72 A37 A37 A37 A43 A43 A43 S13 S13 S64 S64 A64 A64 A64 A30 A30 S103 S103 A80 A80 A80 A23 A23 A23 A85 A85 A85 S84 S84 S71 S71 S71 A73 A73 A73 A96 A96 A96 S43 S43 A60 A60 A60 A11 A11 A11 S22 S22 S39 S39 S39 S68 S68 S68 S110 S110 S110 A65 A65 A65 A33 A33 A33 A34 A34 A34 S8 S8 S34 S34 S66 S66 A105 A105 A105 A67 A67 A67 A89 A89 A89 0 0 S14 S14 S107 S107 S32 S32 S32 A28 A28 A28 S59 S59 S59 S7 S7 S24 S24 S67 S67 S67 S37 S37 S89 S89 S89 A87 A39 A87 A39 A87 A39 S20 S20 S15 S15 A45 A45 A45 A6 A6 S93 S93 S93 A72 A72 A72 A77 A77 A77 S88 S88 S88 S11 S11 A44 A44 S44 S44 S2 S2 S52 S52 S53 S53 S53 A26 A26 A26 A88 A88 A88 A63 A63 S21 S21 A35 A35 A35 A38 A38 A38 A14 S82 A14 S82 A14 S82 S106 S106 S77 S77 S31 S31 S41 S41 S41 A106 A106 A106 A103 A103 S38 S38 S81 S81 S81 S95 S95 S95 A1 A1 A1 A62 A62 A62 S57 S57 S57 S101 S101 S101 A68 A68 A68 S56 S56 S56 S48 S48 S48 S75 S75 S78 S78 S78 S45 S45 S45 A91 A91 A91 S18 S18 S42 S42 S85 S85 S85 A47 A47 A47 S23 S23 S33 S92 S92 S33 A61 A61 A61 A75 A75 A75 A48 A48 A48 A100 A100 A100 A40 A40 A40 A90 A90 A90 S1 S1 S49 S49 S62 S62 A92 A92 S86 S86 S86 S46 S46 S46 S90 S90 S90 A24 A24 A24 A56 A56 A56 S50 S50 S55 S55 S55 A21 A21 A21 A36 A36 A36 S83 S83 S83 A84 A84 A84 A99 A99 A99 S108 S108 S108 S58 S58 S58 A83 A83 A83 A104 A104 A104 S65 S65 S98 S98 A55 A55 A55 - - 20 20 S61 S61 A101 A101 A101 S54 S54 S70 S70 S70 S99 S99 S99 S87 S87 S87 S47 S47 S47 S97 S97 S97 S73 S73 S51 S51 S51 S109 S109 S109 S80 S80 S80 S3 S3 S35 S35 S35 A74 A74 A74 S100 S100 S100 A86 A86 A86 A46 A46 A46 A29 A29 A29 S60 S60 S60 S5 S5 - - 40 40 S6 S6 ESOM - - 60 60 Actual - - 120 120 - - 100 100 - - 80 80 - - 60 60 - - 40 40 - - 20 20 0 0 20 20 40 40 60 60 Scores PC#1 (69.493%) Scores PC#1 (69.493%) ESOM ESOM ESOM Sejet Sejet 25 25 25 30 30 30 35 35 35 40 40 40 45 45 45 Abed Abed 24 24 26 26 28 28 30 30 32 32 34 34 36 36 38 38 40 40 42 42 Predicted ESOM 42 40 38 36 34 32 30 28 26 24 Jane Lindedam¹, Jacob Wagner Jensen², Sander Bruun¹, Claus Felby² and Jakob Magid¹. ¹ Plant and Soil Science Laboratory, Department of Agricultural Sciences, ² Forest & Landscape, Faculty of Life Sciences, University of Copenhagen, Denmark. Hypothesis Wheat is not just wheat when it comes to producing bio-ethanol! The variability of bio-available carbon in wheat straw cultivars is large and potentially exploitable. IntroductionThe European Union (EU) has set up the goal that by the year 2010, 5.75 % of the fuels used for transportation must be produced from biomass. Ethanol produced by fermentation of C5 and C6 sugars derived from lignocellulosic biomass has in many Europeans countries been recognized as one platform to fulfill the directive. Large effort has been put into optimization of pre-treatment, enzyme and fermentation technologies of lignocellulosic biomass conversion. However, little attention has been given to differences between cultivars of the feedstock. Since soil incubations and analyses of feedstuff value indicate that there is large variability in quality of straw, this is also likely to be the case in terms of bio-ethanol production. The objectives are therefore • To provide information on the magnitude and causes for the variability of bio-available carbon in wheat straw cultivars. • To test near infrared reflectance (NIR) spectroscopy as a cheap and quick method to assess the potential of wheat cultivars for bio-ethanol production. How: We have yet to develop a small scale bio-ethanol assay, which includes the pre-treatment. Instead the variability of enzymatic solubility of the wheat cultivars could give us an indication of the ethanol potential. The ESOM-assay (Enzymatic Solubility of Organic Matter) correlates with the in vitro digestibility in rumen and will give us an idea of the bio-availability of the carbon. Results Figure 2: PCA score plot of 107 genotypes of wheat straw grown at two different sites, Sejet (S) and Abed (A). Figure 3: Correlation between measured ESOM values and predicted ESOM values for all genotypes at two different sites. Figure 1: The variation in ESOM values from the two sites The PLS model made on the NIR specters could predict over 75% of the variation in ESOM-values, indicating that NIR spectroscopy is a potential easy way to forecast the straw quality of cultivars (fig. 3). The ESOM-values revealed up to 30% difference in wheat straw digestibility, affected by both the type of cultivar and location (fig. 1). There was a significant correlation between the digestibilities at the two sites indicating that there is a significant effect of the cultivar. One effect of the locations was a large variation in ash-content; straw from Sejet containing twice the ash of the coherent Abed cultivar. PCA score plot of the all the cultivars showed that straw from the two locations can be distinguished on the basis of their NIR spectrum and EFOS values. Generally, straw from Sejet has higher EFOS values then from Abed (fig. 2). Conclusion A 30% variability in carbon bio-availability is large enough to be highly interesting and potentially exploitable in bio-fuel production. To screen the bio-availability of carbon in a very large range of straw materials, we propose using NIR to predict the digestibility of straw. Method and material 107 wheat cultivars were sampled from two different sites in Denmark and measured with ESOM assays as follows: The straw material was milled and sieved (1 mm) before soaking in pepsin acid for 24h at 40°C to dissolve protein. Additional heating to 80°C hydrolyzed the starch and inactivated the pepsin acid, after which incubation in enzyme mixture (cellulase, hemicellulase, γ-amylase, cellobiase) for 24h at 40°C then 19h at 60°C dissolved the digestible cell wall carbohydrates and starch. Fat was extracted from the residue with boiling water and acetone before dry matter and ash content of the treated straw was related to the untreated material (g dissolved/100g dm). NIR spectra were measured on all genotypes in the spectral range from 1100 nm – 2500 nm and used to make a PCA and PLS calibration model predicting the ESOM values. Outlook We are working on producing bioethanol from small samples (5-10 g dw) of the cultivars, to correlate with the NIR spectres. When a wide variaty of cultivars from multiple locations and years have been measured, the model can potentially be used as a tool for differential pricing to the farmer and batch optimized pre-processing based on genotype and environmental conditions during growth. We include historic genotypes to establish if a high genetic component for “good quality straw” is shown and evaluate if the trait may be considered a selection criterion in future cereal breeding programs.