Download
1 / 26
260 likes | 401 Views
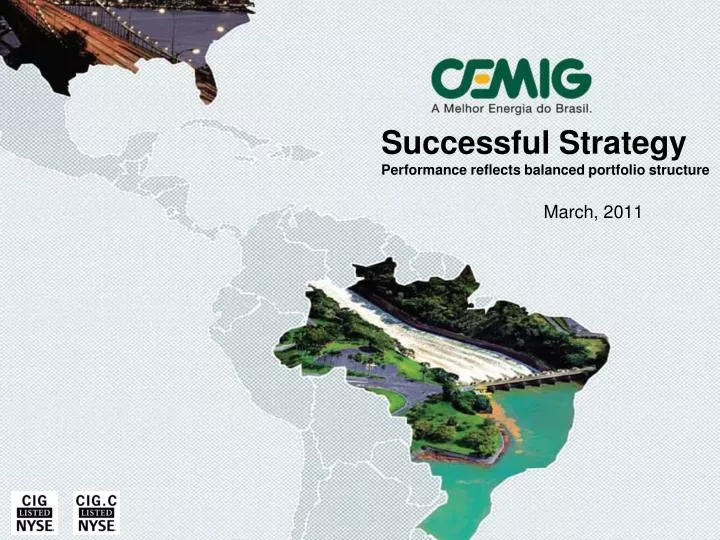
Successful Strategy Performance reflects balanced portfolio structure. March, 2011. Disclaimer.

E N D
SuccessfulStrategyPerformance reflectsbalancedportfoliostructure March, 2011
Disclaimer Some statements and estimates in this material may represent expectations about future events or results that involve risks and uncertainties known and unknown. There is no guarantee that the events or results referred to in these expectations will occur. These expectations are based on present assumptions and analyses from the viewpoint of our management, based on their experience, the macroeconomic environment, market conditions in the energy sector and our expected future results, many of which are not under Cemig’s control. Important factors that can lead to significant differences between actual results and projections about future events or results include Cemig’s business strategy, Brazilian and international economic conditions, technology, Cemig´s financial strategy, changes in the energy sector, hydrological conditions, conditions in the financial markets, uncertainty regarding future results of operations, plans and objectives as well as other factors. Because of these and other factors, our actual results may differ significantly from those indicated in or implied by these statements. The information and opinions contained herein should not be understood as a recommendation to potential investors and no investment decision should be based on the truthfulness, or completeness as of the date hereof of this information or these opinions. None of Cemig’s professionals nor any of their related parties or representatives shall have any liability for any losses that may result from the use of the content of this presentation. To evaluate the risks and uncertainties as they relate to Cemig, and to obtain additional information about factors that could lead to different results from those estimated by Cemig, please consult the section on Risk Factors included in our Formulário de Referência filed with the Brazilian Securities Commission – CVM, and in Form 20-F filed with the U.S. Securities and Exchange Commission – SEC. All figures are in BR GAAP.
Brazil’s Leading Power Utility Integrated Power Utility in Brazil Growth in EBITDA2004-09 Market cap of US$ 11.03(1) B. Role in industry Leadingconsolidator #1 +90% #3 (2) In the Power Industry since 1952 • As of March 2nd, 2011 • In the Power Industry
Number of power plants 66 Total installed capacity 6,896 MW Locations in Minas Gerais State 5,415 Size of concession area vs. France Larger Power Transmission lines Electricity Distribution lines 474,559 km 8,768 km Cemig: Strength in Numbers (1) (1) As of September 30, 2010
Cemig at a Glance • Based in State of Minas Gerais, controlling shareholder • growing throughout Brazil and Chile • Strong financial profile 2009 • Net revenues: R$ 11.7B • EBITDA: R$ 4B • Highest liquidity in sector • listed on 3 stock exchanges New York, São Paulo, Madrid • More than 114,000 shareholders in 44 countries • Average Daily Trading Volume in 2010: • R$42M in Bovespa • US$32M in NYSE • Solid dividend policy • Minimum 50% payout ratio • Every two years, may pay extra dividends, if cash conditions permit • Strong Growth outlook in the long run • Acquisitions • Re-pricing of energy contracts
The Cemig Story – Agenda The positioning The performance The growth
1 The Brazil advantage 2 Unmatched scale 3 Diversified portfolio 4 Leader in renewable energy 5 Strong governance Cemig is Uniquely Positioned
1 BRAZIL ADVANTAGE Latin American economy #1 Ranking of economy in world #7 GDP 2010 US$2.1 Trillion GDP growth 2010 forecast* 7.5% Population 191M Investment grade by Moody’s, Fitch and S&P Power industry net revenue - 2010 >US$145 Billion An Emerging Powerhouse Economy * BACEN – Banco Central do Brasil 02/25/2011 - Focus Report
2 UNMATCHED SCALE #3Largest power transmission group #3Largest power generation group #1 Integrated utility #1 Electricity distributor* + + Power Generation Power Generation (under construction) Power Transmission Power Transmission (under construction) Electricity Distribution Cemig “Free Consumer” Clients Purchase of Energy Wind Power Generation Natural Gas Distribution Largest Integrated Utility in Brazil RR AP MA AM PA CE RN PB PI PE AC AL TO RO SE BA MT DF MG GO ES MS SP Telecom Backbone Provider RJ PR SC RS * in terms of length of electricity distribution lines
DIVERSIFIED 3 Diversified, Low Risk Business Portfolio Breakdown of EBITDA (2009) Most of revenues are inflation protected
4 RENEWABLE LEADER Leader in Renewable Hydro Power Energy Power Generation by Source Fossil Source Fuels Nuclear Hydro Others
5 GOVERNANCE Best-in-Class Corporate Governance • Minas Gerais, controlling shareholder – a positive influence • one of fastest growing, investor-friendly states in Brazil • growth and profitability interest aligned with minority shareholders • 6 from a total of 14 members are appointed by minority shareholders • Pro-market corporate bylaws include • Minimum 50% dividend payout • Capex limited to 40% of EBITDA • Net debt limited to 2.5x EBITDA • Net debt limited to 50% of total cap. Minas Gerais • Leader in sustainability • only Latin American utility in DJSI since 1999 • Included in the ISE – Bovespa sustainability index • since 2005 • Present in the Global Dow Index
The Cemig Story – Agenda The positioning The performance The growth
7% CAGR Growth in EBITDA R$ billion EBITDA Margin: 33% (*)Up to September 30, 2010
3% CAGR Net Income Continues to Expand R$ million Net Margin:14% (*)Up to September 30, 2010
Attractive and Secure Dividend Payout (1) Dividend Payout Dividend Yield (% of Net Income) (%) • Proposal for 2009 Net Income distribution was approved: • Ordinary Dividends of R$ 931 million - Dividends per share: R$1.50 • Stock Dividend of 10% • Extraordinary Dividends was also approved: • R$900 million – Dividends per share: R$1.31 • 2010 Dividend Yield (for shares traded at Bovespa; price as of December 29,2009): • Preferred Share: 9.3% Common Share: 12.1% (1) Dividends approved for the year net income, paid in the coming year in semi-annual basis
Net debt to EBITDA 2.1X Debt in foreign currency(*) < 2% Cash on hand R$4.2B Net Revenue 2010 R$ 9.1B Strong Balance Sheet to Support Growth (September 30th, 2010) *Net of financial hedging
EBITDA guidance EBITDA guidance(1) 2010-2014 R$ million(upper + lower limits of range) Consolidated figures include values from Holding andother holdings. • Constant currency as of June 2010. Considers just the existing assets. Will be revised by May 2011
The Cemig Story – Agenda The positioning The performance The growth
Clear Long Term Goals Current Share of Brazil Markets Long Term Goal 20% Share of ALL power markets
Target Ebitda contributionby businessin the longrun CIA. ENERGÉTICA DE MINAS GERAIS Power Generation Power Transmission Electricity Distribution Natural Gas Distribution Telecom Services 40% 20% 40%
Growth Drivers $ 1 Leverage price increases 2 Improve operating efficiency 3 Geographic expansion
GROWTH DRIVER #2 Record of Successful Acquisitions Business Model for Growth • Record of 5 acquisitions in last 5 years totaling R$ 3B (excluding debt) • Partnerships with Equity Investment Funds (FIPs) in recent acquisitions (Terna and Light) create a new growth driver • Structuring of partnerships with FIPs produces a growth strategy that optimizes capital needs • Attractive return to investors, at low risk • Best-in-class Corporate Governance • Investors enter as financial partners and Cemig • as operating partner • Possibility of increasing stake in the future • Strategic positioning with minority or equal interests assures Cemig greater access to financial capital markets • Innovative acquisition structure enables Cemig to use it in other expansion opportunities, aligned with its Long-Term Strategic Plan. CEMIG Investment Fund High level of corporate governance SPE Acquisition 23
Execute cost reductions 1 Integrate Terna and Light acquisitions 2 3 Participate in green fields 4 Select new acquisitions Clear Priorities for 2011 Priorities
Leading power utility in Brazil Strong Dividend Policy Consistent profitable track record Sound Balance Sheet Powerful drivers fueling growth World Leader in Sustainability Why Invest in Cemig
Investor Relations Telefone: (55-31) 3506-5024 Fax: (55-31) 3506-5025 Email: ri@cemig.com.br Website: http://ri.cemig.com.br