Download
1 / 1
30 likes | 274 Views
Principal components analysis (PCA) as a tool for identifying EEG frequency bands: II. Dissociation of resting alpha asymmetries Stefan Debener 1 , Jürgen Kayser 2 , Craig E. Tenke 2 & André Beauducel 1

E N D
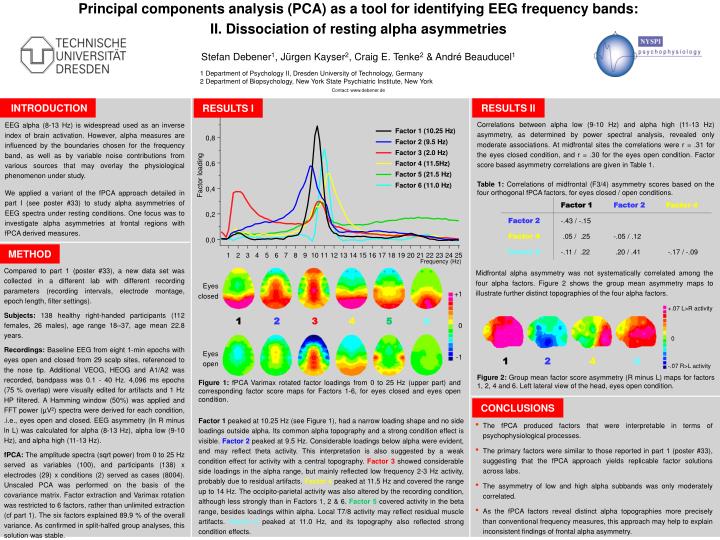
Principal components analysis (PCA) as a tool for identifying EEG frequency bands: II. Dissociation of resting alpha asymmetries Stefan Debener1, Jürgen Kayser2, Craig E. Tenke2 & André Beauducel1 1 Department of Psychology II, Dresden University of Technology, Germany 2 Department of Biopsychology, New York State Psychiatric Institute, New York Contact: www.debener.de INTRODUCTION RESULTS II RESULTS I Correlations between alpha low (9-10 Hz) and alpha high (11-13 Hz) asymmetry, as determined by power spectral analysis, revealed only moderate associations. At midfrontal sites the correlations were r = .31 for the eyes closed condition, and r = .30 for the eyes open condition. Factor score based asymmetry correlations are given in Table 1. Table 1: Correlations of midfrontal (F3/4) asymmetry scores based on the four orthogonal fPCA factors, for eyes closed / open conditions. EEG alpha (8-13 Hz) is widespread used as an inverse index of brain activation. However, alpha measures are influenced by the boundaries chosen for the frequency band, as well as by variable noise contributions from various sources that may overlay the physiological phenomenon under study. We applied a variant of the fPCA approach detailed in part I (see poster #33) to study alpha asymmetries of EEG spectra under resting conditions. One focus was to investigate alpha asymmetries at frontal regions with fPCA derived measures. Factor loading METHOD Frequency (Hz) Compared to part 1 (poster #33), a new data set was collected in a different lab with different recording parameters (recording intervals, electrode montage, epoch length, filter settings). Subjects: 138 healthy right-handed participants (112 females, 26 males), age range 18–37, age mean 22.8 years. Recordings: Baseline EEG from eight 1-min epochs with eyes open and closed from 29 scalp sites, referenced to the nose tip. Additional VEOG, HEOG and A1/A2 was recorded, bandpass was 0.1 - 40 Hz. 4,096 ms epochs (75 % overlap) were visually edited for artifacts and 1 Hz HP filtered. A Hamming window (50%) was applied and FFT power (µV2) spectra were derived for each condition, .i.e., eyes open and closed. EEG asymmetry (ln R minus ln L) was calculated for alpha (8-13 Hz), alpha low (9-10 Hz), and alpha high (11-13 Hz). fPCA: The amplitude spectra (sqrt power) from 0 to 25 Hz served as variables (100), and participants (138) x electrodes (29) x conditions (2) served as cases (8004). Unscaled PCA was performed on the basis of the covariance matrix. Factor extraction and Varimax rotation was restricted to 6 factors, rather than unlimited extraction (cf part 1). The six factors explained 89.9 % of the overall variance. As confirmed in split-halfed group analyses, this solution was stable. Midfrontal alpha asymmetry was not systematically correlated among the four alpha factors. Figure 2 shows the group mean asymmetry maps to illustrate further distinct topographies of the four alpha factors. Eyes closed Eyes open +1 0 -1 +.07 L>R activity 0 -.07 R>L activity 123456 1 2 46 Figure 2: Group mean factor score asymmetry (R minus L) maps for factors 1, 2, 4 and 6. Left lateral view of the head, eyes open condition. Figure 1: fPCA Varimax rotated factor loadings from 0 to 25 Hz (upper part) and corresponding factor score maps for Factors 1-6, for eyes closed and eyes open condition. CONCLUSIONS Factor 1 peaked at 10.25 Hz (see Figure 1), had a narrow loading shape and no side loadings outside alpha. Its common alpha topography and a strong condition effect is visible. Factor 2 peaked at 9.5 Hz. Considerable loadings below alpha were evident, and may reflect theta activity. This interpretation is also suggested by a weak condition effect for activity with a central topography. Factor 3 showed considerable side loadings in the alpha range, but mainly reflected low frequency 2-3 Hz activity, probably due to residual artifacts. Factor 4 peaked at 11.5 Hz and covered the range up to 14 Hz. The occipito-parietal activity was also altered by the recording condition, although less strongly than in Factors 1, 2 & 6. Factor 5covered activity in the beta range, besides loadings within alpha. Local T7/8 activity may reflect residual muscle artifacts. Factor 6 peaked at 11.0 Hz, and its topography also reflected strong condition effects. • The fPCA produced factors that were interpretable in terms of psychophysiological processes. • The primary factors were similar to those reported in part 1 (poster #33), suggesting that the fPCA approach yields replicable factor solutions across labs. • The asymmetry of low and high alpha subbands was only moderately correlated. • As the fPCA factors reveal distinct alpha topographies more precisely than conventional frequency measures, this approach may help to explain inconsistent findings of frontal alpha asymmetry.