Download
1 / 27
320 likes | 771 Views
Detecting CNV by Exome Sequencing. Fah Sathirapongsasuti Biostatistics, HSPH. Exome Sequencing. Capturing protein coding portion of the genome. ~85% of the disease-causing mutations occur in protein coding regions (exome) Exome constitutes 1% of the genome About 160,000-180,000 exons

E N D
Detecting CNV by Exome Sequencing FahSathirapongsasuti Biostatistics, HSPH
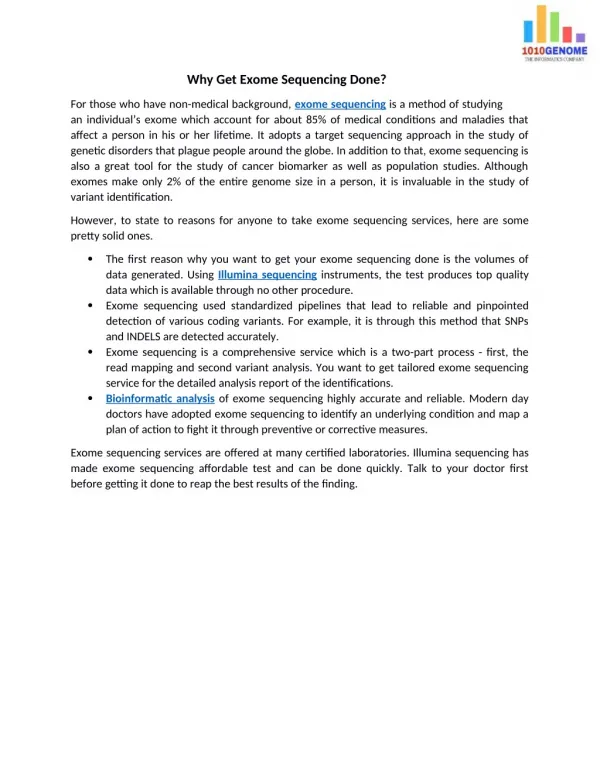
Exome Sequencing • Capturing protein coding portion of the genome • ~85% of the disease-causing mutations occur in protein coding regions (exome) • Exome constitutes 1% of the genome • About 160,000-180,000 exons • Time-saving and cost-effective
FASTA/FASTQ SAM/BAM SAM/BAM SAM/BAM SAM/BAM SAM/BAM Coverage VCF/BCF VCF/BCF
Pileup • Standard format for mapped data, position summaries seq1 272 T 24 ,.$.....,,.,.,...,,,.,..^+. <<<+;<<<<<<<<<<<=<;<;7<& seq1 273 T 23 ,.....,,.,.,...,,,.,..A <<<;<<<<<<<<<3<=<<<;<<+ seq1 274 T 23 ,.$....,,.,.,...,,,.,... 7<7;<;<<<<<<<<<=<;<;<<6 seq1 275 A 23 ,$....,,.,.,...,,,.,...^l. <+;9*<<<<<<<<<=<<:;<<<< seq1 276 G 22 ...T,,.,.,...,,,.,.... 33;+<<7=7<<7<&<<1;<<6< seq1 277 T 22 ....,,.,.,.C.,,,.,..G. +7<;<<<<<<<&<=<<:;<<&< seq1 278 G 23 ....,,.,.,...,,,.,....^k. %38*<<;<7<<7<=<<<;<<<<< seq1 279 C 23 A..T,,.,.,...,,,.,..... ;75&<<<<<<<<<=<<<9<<:<< Seq. Pos. Len. Alignment Quality Ref.
Variant Call Format ##format=PCFv1 ##fileDate=20090805 ##source=myImputationProgramV3.1 ##reference=1000GenomesPilot-NCBI36 ##phasing=partial #CHROM POS ID REF ALT QUAL FILTER INFO FORMAT NA00001 NA00002 20 14370 rs6054257 G A 29 0 NS=58;DP=258;AF=0.786;DB;H2 GT:GQ:DP:HQ 0|0:48:1:51,51 1|0:48:8:51,51 20 13330 . T A 3 q10 NS=55;DP=202;AF=0.024 GT:GQ:DP:HQ 0|0:49:3:58,50 0|1:3:5:65,3 20 1110696 rs6040355 A G,T 67 0 NS=55;DP=276;AF=0.421,0.579;AA=T;DB GT:GQ:DP:HQ 1|2:21:6:23,27 2|1:2:0:18,2 20 10237 . T . 47 0 NS=57;DP=257;AA=T GT:GQ:DP:HQ 0|0:54:7:56,60 0|0:48:4:51,51 20 123456 microsat1 G D4,IGA 50 0 NS=55;DP=250;AA=G GT:GQ:DP 0/1:35:4 0/2:17:2 ##format=PCFv1 ##fileDate=20090805 ##source=myImputationProgramV3.1 ##reference=1000GenomesPilot-NCBI36 ##phasing=partial #CHROM POS ID REF ALT QUAL FILTER INFO 20 14370 rs6054257 G A 29 0 NS=58;DP=258;AF=0.786;DB;H2 FORMAT NA00001 NA00002 GT:GQ:DP:HQ 0|0:48:1:51,51 1|0:48:8:51,51
Copy-Number Variation/Alteration • CNV • gains and losses of chunks of DNA sequences • Sizes: • 1kb-5Mb (Sanger’s CNV Project) • Generally large chunks … • Small gains/losses are called insertion/deletion (in-del) Comparative Genomic Hybridisation Blue lines: individuals with two copies. Red line: individual with zero copy.
CNV method specific for ExomeSeq is needed • All techniques were developed for whole genome sequencing or targeted sequencing of one continuous region. • Two approaches: • Paired-End Methods (use insert size) • Depth of Coverage • Challenges of Exome Sequencing: • Discontinuous search space • Paired-end methods won’t work • The only natural way to discretize the data is by exon • Resolution is limited by distance between exons • Non-uniform distribution of reads • Exon capture probes have different efficiency
Depth of Coverage Approach • Treat one exon as a unit (variable length) • Measure depth of coverage (average coverage) per exon • Key assumptions: • Number of reads over exons of certain size follows Poisson distribution • Average coverage is directly proportional to the number of reads; i.e. average coverage = #reads * read length / exon length
Using the ratio of depth-of-coverage to detect CNV arbitrary cutoff Sensitivity = Power Specificity Null: no CNV shift Alt: CNV shift
Power to detect CNV depends on depth-of-coverage Deletion Duplication
It is generally harder to detect higher copy number as the variance increases linearly with the mean Deletion Duplication
Issue: Admixture • Tumor sample is usually contaminated with normal cells • Ratio will tend to 1, making it more difficult to detect CNV • Have to estimate admixture rate prior to calling CNV otherwise power may be over/underestimated. 50% admixture
ExomeCNV Overview • library(ExomeCNV) • chr.list = c("chr19","chr20","chr21") • suffix = ".coverage" • prefix = "http://genome.ucla.edu/~fah/ExomeCNV/data/normal." • normal = read.all.coverage(prefix, suffix, chr.list, header=T) • prefix = "http://genome.ucla.edu/~fah/ExomeCNV/data/tumor." • tumor = read.all.coverage(prefix, suffix, chr.list, header=T) • source("http://bioconductor.org/biocLite.R") • biocLite("DNAcopy") • install.packages("ExomeCNV")
Exome CNV Calling Method • Idea: • Use ROC to determine optimum ratio cutoff for a given exon of certain length and coverage • Only make a call when enough power can be achieved • demo.eCNV = c() • for (i in 1:length(chr.list)) { • idx = (normal$chr == chr.list[i]) • ecnv = classify.eCNV(normal=normal[idx,], tumor=tumor[idx,], logR=demo.logR[idx], min.spec=0.9999, min.sens=0.9999, option="spec", c=0.5, l=70) • demo.eCNV = rbind(demo.eCNV, ecnv) • } • do.plot.eCNV(demo.eCNV, lim.quantile=0.99, style="idx", line.plot=F) • demo.logR = calculate.logR(normal, tumor) Calculate log adjusted ratio Optimize cutoff based on read coverage, exon length, and estimated admixture rate Call CNV on each exon
Merging exonic CNVs into segments • Circular binary segmentation
Breakpoint Identification and Sequential Merging • demo.cnv = multi.CNV.analyze(normal, tumor, logR=demo.logR, all.cnv.ls=list(demo.eCNV), coverage.cutoff=5, min.spec=0.99, min.sens=0.99, option="auc", c=0.5) • do.plot.eCNV(demo.cnv, lim.quantile=0.99, style="bp", bg.cnv=demo.eCNV, line.plot=T) • Sequential merging: • Use circular binary segmentation (CBS) algorithm to identify breakpoints, then use the above method to call CNV for segments • Merge exon with no CNV call, normal call, or same CNV call Call CNV on each exon Run CBS to merge exons into segments Call CNV on each segment Merge with previous CNV segments
Resources • https://secure.genome.ucla.edu/index.php/ExomeCNV_User_Guide • JF Sathirapongsasuti, et al. (2011) Exome Sequencing-Based Copy-Number Variation and Loss of Heterozygosity Detection: ExomeCNV, Bioinformatics, 2011 Oct 1;27(19):2648-54. Epub 2011 Aug 9.