Download
1 / 17
170 likes | 311 Views
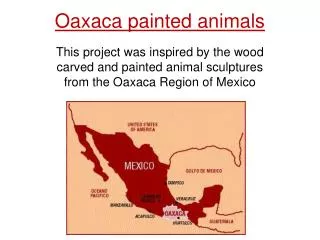
Infrastructure Investment . CMIC Presentation to the North American Construction Federation Conference Oaxaca, Oaxaca Mexico August 17-20, 2011. Index. Market Size 2. Challenges 3. Proposals 4. Innovation. Construction Investment 2000-2010 (Public-Private).

E N D
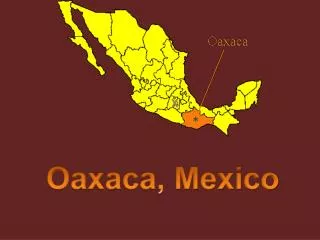
Infrastructure Investment CMIC Presentation to the North American Construction Federation Conference Oaxaca, OaxacaMexico August 17-20, 2011
Index • Market Size • 2. Challenges • 3. Proposals • 4. Innovation
Construction Investment 2000-2010 (Public-Private) Billion dollars(participation percentage) 160.0 143.2 142.1 131.3 Private investment 126.5 112.9 65.7% 69.5% 59.9% 59.8% 71.1% 69.5% Public investment 40.1% 34.3% 40.2% 28.9% 30.5% 30.5% 3 Source: National Institute of Statistics, Geography and Information (INEGI).
Federal Budgetary Physical Investments 2005-2011 Infrastructure impulse: investment doubled in six years Billion dollars Source: Mexican Internal Revenue Service (SHCP). 4
Federal Budgetary Physical Investment Conformation 2005-2010 Billion dollars (Participation by Sectors) 53.4 51.1 43.4 38.1 34.6 29.2 26.0 5 Source: Mexican Internal Revenue Service (SHCP).
Federal Budgetary Physical Investment Conformation Percentage advance (%) Public Resources Allocated to Projectsof Infrastructure Investment for 2011 Progress in the Implementation of Public Resources for May 2011 Percentage advance (%) The average advance in May was of 17.7% Bids granted / counter amended budget 6 Source: Mexican Internal Revenue Service (SHCP).
Competitiveness in Mexico related to Infrastructure Despite the effort to impulse the Infrastructure Administration, Mexico is loosing competitiveness Target: Number 1 as the best position. Number 139 as the worst position. Source: World Economic Forum 2010-2011. 7
Challenges in Infrastructure Projects (I) I. Long term strategic planning • Bank of Projects • Project prioritization and scheduling • A more efficient allocation of the resources • Complete executive projects • Construction companies with an horizon of delimited projects 8
Challenges in Infrastructure Projects (II) II. More efficient operation • Coordination amongst governmental offices and responsible entities. • Reduce procedures and requirements. • Investment developer regulations (PPPs). 9
Challenges in Infrastructure Projects (III) III. Easier access to competitive financing • Worldwide competitive interest rates • Reduction of requirements • Reasonable guarantees • Emphasize the project, not only the constructor 10
Innovation: Proporsals for an infrastructure impulse Modernize the legal and regulatory frameworks Developing long term market debt Specializing institutions towards construction Public/Private Partnerships (PPP’s) 11
Insfraestructure Situation CMIC Presentation to the North American Construction Federation Conference Oaxaca, OaxacaMexico August 17-20, 2011
Competitiveness in infrastructure United States: competitiveness decreased from 12 to 15 1 = Best position 139= Worst position 6 7 8 12 15 * Canada: competitiveness increased from 13 to 9 1= Best position 139= Worst position 6 8 7 9 13 Source: Economics and Financing Management with World Economic Forum information. 14
3. Technologic Innovation in Infrastructure Baluarte Bridge Durango-Mazatlán Highway • The longest braced bridge in America (in construction). • Located in the borderline of Durango and Sinaloa • Length 3,688 ft, height over the hill 1,293 ft. 15
4. Technologic Innovation in Infrastructure Total cost: 210 million dollars. Baluarte Bridge 16
Inversión Física Presupuestaria Federal 2010-2011 (Billiondollars) Source: Mexican Internal Revenue Service (SHCP). 17