Download
1 / 1
10 likes | 110 Views
Deviation of Acc. precip. of target cell from Acc. Reference precip. Σ ( P i - R i ). 0. Acc. precip. of reference Σ R i. Diagnosis of inconsistencies in multi-year gridded precipitation data over mountainous areas and related impacts on hydrologic simulations.

E N D
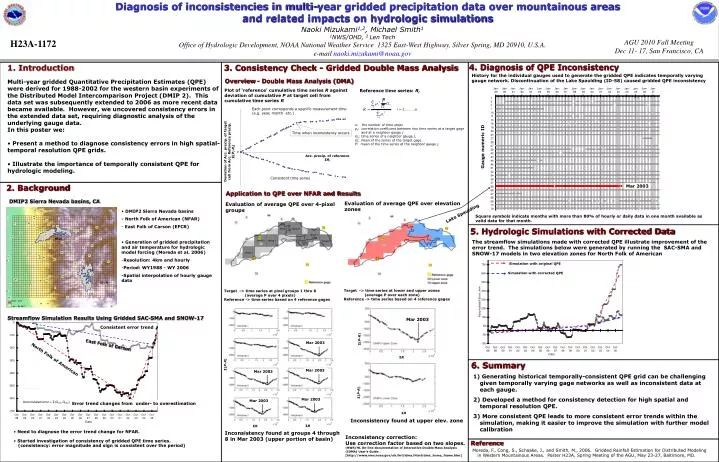
Deviation of Acc.precip. of target cell from Acc. Reference precip. Σ(Pi-Ri) 0 Acc.precip. of reference ΣRi Diagnosis of inconsistencies in multi-year gridded precipitation data over mountainous areas and related impacts on hydrologic simulations Naoki Mizukami1,2, Michael Smith1 1NWS/OHD, 2 Len Tech Office of Hydrologic Development, NOAA National Weather Service 1325 East-West Highway, Silver Spring, MD 20910, U.S.A. e-mail naoki.mizukami@noaa.gov H23A-1172 AGU 2010 Fall Meeting Dec 11- 17, San Francisco, CA 4. Diagnosis of QPE Inconsistency • 1. Introduction • Multi-year gridded Quantitative Precipitation Estimates (QPE) were derived for 1988-2002 for the western basin experiments of the Distributed Model Intercomparison Project (DMIP 2). This data set was subsequently extended to 2006 as more recent data became available. However, we uncovered consistency errors in the extended data set, requiring diagnostic analysis of the underlying gauge data. • In this poster we: • Present a method to diagnose consistency errors in high spatial-temporal resolution QPE grids. • Illustrate the importance of temporally consistent QPE for hydrologic modeling. 3. Consistency Check - Gridded Double Mass Analysis History for the individual gauges used to generate the gridded QPE indicates temporally varying gauge network. Discontinuation of the Lake Spaulding (ID-58) caused gridded QPE inconsistency Overview - Double Mass Analysis (DMA) Plot of ‘reference’ cumulative time series R against deviation of cumulative P at target cell from cumulative time series R Reference time series: Ri Each point corresponds a specific measurement time (e.g. year, month etc.) n: the number of time steps ρj: correlation coefficient between two time series at a target gage and at a neighbor gauge j Gij: time series of a neighbor gauge j, Gj: mean of the series at the target gage. P: mean of the time series at the neighbor gauge j. Time when inconsistency occurs Gauge numeric ID Consistent time series 2. Background Mar 2003 Application to QPE over NFAR and Results DMIP2 Sierra Nevada basins, CA Evaluation of average QPE over elevation zones Evaluation of average QPE over 4-pixel groups • DMIP2 Sierra Nevada basins • - North Folk of American (NFAR) • East Folk of Carson (EFCR) • Generation of gridded precipitation and air temperature for hydrologic model forcing (Moreda et al. 2006) • Resolution: 4km and hourly • Period: WY1988 - WY 2006 • -Spatial interpolation of hourly gauge data Lake Spaulding Square symbols indicate months with more than 80% of hourly or daily data in one month available as valid data for that month. 5. Hydrologic Simulations with Corrected Data The streamflow simulations made with corrected QPE illustrate improvement of the error trend. The simulations below were generated by running the SAC-SMA and SNOW-17 models in two elevation zones for North Folk of American Simulation with original QPE Simulation with corrected QPE Target -> time series at lower and upper zones (average P over each zone) Reference -> time series based on 4 reference gages Target -> time series at pixel groups 1 thru 8 (average P over 4 pixels) Reference -> time series based on 4 reference gages Streamflow Simulation Results Using Gridded SAC-SMA and SNOW-17 Mar 2003 Consistent error trend Σ(P-R) Mar 2003 East Folk of Carson ΣR North Folk of American 6. Summary Σ(P-R) Mar 2003 Mar 2003 • Generating historical temporally-consistent QPE grid can be challenging given temporally varying gage networks as well as inconsistent data at each gauge. • Developed a method for consistency detection for high spatial and temporal resolution QPE. • More consistent QPE leads to more consistent error trends within the simulation, making it easier to improve the simulation with further model calibration Σ(P-R) Mar 2003 Mar 2003 Error trend changes from under- to overestimation ΣR Inconsistency found at upper elev. zone ΣR ΣR • Need to diagnose the error trend change for NFAR. • Started investigation of consistency of gridded QPE time series. • (consistency: error magnitude and sign is consistent over the period) Inconsistency found at groups 4 through 8 in Mar 2003 (upper portion of basin) Inconsistency correction: Use correction factor based on two slopes. (NWS/HL On-line documentation of Interactive Double Mass Analysis (IDMA) User's Guide . [http://www.nws.noaa.gov/oh/hrl/idma/html/dma_home_frame.htm] Reference Moreda, F., Cong, S., Schaake, J., and Smith, M., 2006. Gridded Rainfall Estimation for Distributed Modeling in Western Mountainous Areas. Poster H23A, Spring Meeting of the AGU, May 23-27, Baltimore, MD.