Download
1 / 22
220 likes | 359 Views
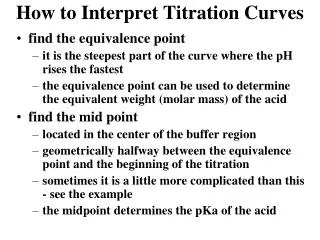
How to Interpret Effect size in CBT–PBT Comparability Studies. Presented By Leah Tepelunde Kaira. Order of Presentation. Introduction Purpose of study Review of Literature Method Results Concluding remarks. Introduction. Use of computerized testing has increased over the past decade

E N D
How to Interpret Effect size in CBT–PBT Comparability Studies Presented By Leah Tepelunde Kaira Dr. Nambury Raju Summer Internship Program
Order of Presentation Introduction Purpose of study Review of Literature Method Results Concluding remarks Dr. Nambury Raju Summer Internship Program
Introduction • Use of computerized testing has increased over the past decade • immediate scoring and reporting of results • more flexible test administration schedules • greater test administration efficiency • Due to limited resources, education systems provide both computer based (CBT) and paper based (PBT) tests Dr. Nambury Raju Summer Internship Program
Introduction continued • Standards (AERA et. al, 1999) require a “clear rationale and supporting evidence” (Standard 4.10, p. 57) that scores obtained from CBT and PBT can be used interchangeably • International Test Commission (ITC) requires that testing agencies “provide clear documented evidence of equivalence …” (ITC, 2005. p21) Dr. Nambury Raju Summer Internship Program
Introduction continued • Although professional guidelines stipulate some methods that could be employed to examine comparability, they are silent with respect to how to judge comparability • The lack of criteria has resulted in educational testing researchers using professional judgment or guidelines employed in other fields • Among the mostly used guidelines are those suggested by Cohen (1988) • Problem: May be misleading because in some areas (e.g. education), small effect sizes are more likely Dr. Nambury Raju Summer Internship Program
Purpose of study • Provide guidelines in interpreting effect sizes in comparability studies • Questions: • How should effect sizes in comparability studies be interpreted? • Does size of score scale have an impact on effect size? • Does sample size have an impact on effect size? • Does magnitude of effect size depend on the score distribution? Dr. Nambury Raju Summer Internship Program
Related Literature • Choi and Tinkler (2002) compared CBT and PBT scores from math and reading for grades 3 and 10. • compared item difficulty estimates and calculated difference weighted by standard error • Compared mean ability estimates across the modes and grades to assess comparability. • Reading items were coded based on their textual focus to assess the relationship between textual focus and item difficulty estimates. Dr. Nambury Raju Summer Internship Program
Related literature continued • More reading items were flagged compared to math. • Higher mean differences in item difficulty estimates for 3rd graders than 10th graders, and larger mean differences were observed in reading than in math. • Within grade comparisons showed reading items for 3rd grade became harder on a computer than on paper. Such a difference was negligible at 10th grade. • Mode effect was larger for reading that math • It is noted that this study does not provide guidelines on how to evaluate the size of effect. In addition, no empirical evidence is provided for using an absolute d-value of 2 for flagging differentially difficult items for the two administration modes. Dr. Nambury Raju Summer Internship Program
Related literature continued • Pearson (2007) evaluated comparability of online and paper field tests • Students were matched on reading, math, and writing scale score, gender, ethnic group and field test form. • A standardized difference (Zdiff) was calculated for both the theta and difficulty parameter estimates. • Cohen’s (1992) guidelines were used to interpret effect size. • Standardized mean differences in theta were also small except in one form where larger standardized mean differences and effect sizes were observed for white, Hispanic, and students that indicated ‘other’ as their ethnicity. The observed effect sizes were small based on Cohen’s guidelines • Comparison of difficulty parameters resulted in flagging of 24 items that had standardized mean differences of ±1.96. However, the associated effect sizes for all flagged items were 0.20 or less Dr. Nambury Raju Summer Internship Program
Related literature continued • Kim and Huynh (2007) investigated equivalence of scores from CBT and PBT versions of Biology and Algebra end of course exams. • Results were analyzed by examining differences in scale scores, item parameters, ability estimates at the content domain level • An effect size measure (g) was used to evaluate the differences. Cohen’s criteria was used to judge the magnitude of g. Dr. Nambury Raju Summer Internship Program
Related Literature continued • Items were recalibrated and parameter estimates were compared to parameters in the bank. Robust Z and average absolute difference (AAD) statistics were used to examine significant difference • TCCs and TIFs of CBT and PBT were also compared. • Results showed small differences in scaled scores as measured by the effect size. High correlations were observed between recalibrated and bank item parameters. • The AAD statistic ranged from 0.29 to 0.37 with small differences between CBT and PBT. TCCs and TIFs for CBT and PBT were generally comparable in both subjects. Dr. Nambury Raju Summer Internship Program
Related Literature continued • Criteria used in evaluating comparability • Difference in mean scores • Difference in item difficulty estimates • Difference in ability parameter estimates • Difference in TCCs and TIFs Dr. Nambury Raju Summer Internship Program
Method • Study conditions • 2 score scale sizes • 4 score distributions • 4 sample sizes Dr. Nambury Raju Summer Internship Program
Method • Procedure • Compute baseline TCC using operational item parameters and theta values • Simulate performance of CBT learners on the test by manipulating the item difficulty parameter such that the maximum difference in expected score between CBT and PBT groups is 0.1. Compute a TCC. • Repeat the procedure in (b) above to reflect maximum differences in expected scores () of 0.2 to 3.00 in increments of 0.1. • For each of the simulated TCCs, compute scaled scores for various raw scores • Using the scaled scores computed in step d, compute effect size between 2 TCCs. Dr. Nambury Raju Summer Internship Program
Results Dr. Nambury Raju Summer Internship Program
Results- Empirical distribution Dr. Nambury Raju Summer Internship Program
Results- Normal distribution Dr. Nambury Raju Summer Internship Program
Results – Negatively skewed distribution Dr. Nambury Raju Summer Internship Program
Results- positively skewed distribution Dr. Nambury Raju Summer Internship Program
Results- Summary • Both sample size and score distribution have an impact on effect size • Better results obtained with roughly equal sample sizes • Larger effect sizes observed with skewed distributions than empirical and normal distributions Dr. Nambury Raju Summer Internship Program
Concluding remark • Researchers evaluating comparability of CBT and PBT scores may need to be more cautious in using Cohen’s guidelines to judge comparability Dr. Nambury Raju Summer Internship Program
Thank You ! Suggestions and comments are welcome! Dr. Nambury Raju Summer Internship Program