Download
1 / 40
400 likes | 695 Views
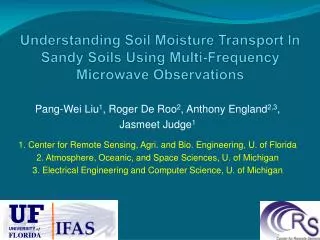
Wide-Area Soil Moisture Estimation Using the Propagation of Low-Frequency Electromagnetic Signals. William Scheftic (Graduate Student, Atmospheric Sciences, University of Arizona) Kenneth L. Cummins and E. Philip Krider (Atmospheric Sciences, University of Arizona)

E N D
Wide-Area Soil Moisture Estimation Using the Propagation of Low-Frequency Electromagnetic Signals William Scheftic (Graduate Student, Atmospheric Sciences, University of Arizona) Kenneth L. Cummins and E. Philip Krider (Atmospheric Sciences, University of Arizona) David Goodrich, Susan Moran, and Russell Scott (USDA Southwest Watershed Research Center)
Discussion Outline • Finite soil surface conductivity has a quantifiable effect on surface-wave radio propagation in the 100 kHz to 1 MHz range • Brief theoretical explanation • Lightning Based method • Methodology • Preliminary results • Some Limitations • Radio transmission method • Overview of summer 2007 field campaign
Effect of finite conductivity on surface-wave signal propagation (propagation model of Norton, 1937): Conductivity = 10 mS/m; Propagation distance = 100 km Signal Attenuation Phase [rad] Freq [Hz]
Variation with Conductivity • Soil – Low pass filter on propagating fields • Smaller conductivity or larger distance: lower cutoff-frequency
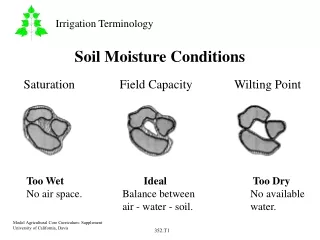
%W=0.34 Electrical Conductivity (mS/m) σ=2. Percent soil saturation Electrical conductivity varies with soil moisture content
Lightning Background Cloud-to-ground lightning electromagnetic fields: (b) First, and (c) Subsequent strokes
Propagation Animation - 75->450 km distanceConductivity = 5 mS/m 75 km
Rudimentary LTG Method • Select desired path for analysis • Starting at a polygon that defines the lightning-observation region • Ending at a sensor location (e.g., Lordsburg; Williams) • Evaluate risetime of lightning waveform measured by the selected sensor. • Convert risetime to apparent electrical conductivity • Convert apparent conductivity to soil moisture • Used North American Regional Reanalysis (NARR) as validation Window Rock Williams Polygon Yuma Tucson 200 km Lordsburg Sensor Path
Limitations • Other factors affect conductivity changes • Soil temperature, soil salinity, conductivity gradient over a several-meter depth • No perfect set of wide-area data for validation • NARR can miss precipitation events as occurred for at least one of the 2005 lightning events. • The size of the lightning region being analyzed determines how similar lightning to sensor paths really are. • Must have lightning!!
dab Sb da Sa Tx Sc Latitude dc Longitude An alternate signal source is man-made narrow-band radio signals(LORAN, NDB, AM radio stations)
E μSec φ The effect can be seen as changes in magnitude and phase for narrow-band radio signals
RadioTX Field Campaign ‘07 • June->October Field Campaign in San Pedro Basin • Three broadband sensors • Remote control from PAS • Measure mag/phase vs. fq. • Derive conductivity • Correlate with WG and San Pedro in-situ measurements, and NARR Note: 18 AM transmitter within 100km of Tombstone
Wide-area Validation:North American Regional Reanalysis • Specifications • 32 km resolution, every 3 hours • Available from Jan 1979 through Feb 2007 • Adequate representation of hydrologic balance • Uses NOAH LSM ver. 2.6 • 4 soil depth layers • Uses hourly rain gauge data and PRISM technique to assimilate precipitation