Download

1 / 13
130 likes | 335 Views
Wavelets and Ranking of database query results. Prepared by -Archana vijayalakshmanan. Contents. Wavelets Haar wavelets Haar wavelet coefficients Examples Comparison with sampling AQP methods Ranking Similarity function Examples . Wavelets.

E N D
Wavelets and Ranking of database query results Prepared by -Archana vijayalakshmanan
Contents • Wavelets • Haar wavelets • Haar wavelet coefficients • Examples • Comparison with sampling • AQP methods • Ranking • Similarity function • Examples
Wavelets • In signal processing community, wavelets are used to break the complicated signal into single component. Similarly in this context wavelets are used to break the dataset into simple component. • Haar wavelet - simple wavelet, easy to understand
[1.5, 4] [0.5, 0] [2.75] [-1.25] Resolution Averages Detail Coefficients Haar Wavelet ---- 3 [2, 2, 0, 2, 3, 5, 4, 4] 2 [2, 1, 4, 4] [0, -1, -1, 0] 1 0 wavelet decomposition(wavelet transform): [2.75, -1.25, 0.5, 0, 0, -1, -1, 0]
[2.75, -1.25, 0.5, 0, 0, -1, -1, 0] Haar Wavelet Coefficients • Using wavelet coefficients one can pull the raw data • Keep only the large wavelet coefficients and pretend other coefficients to be 0. [2.75, -1.25, 0.5, 0, 0, 0, 0, 0]-synopsis of the data • The elimination of small coefficients introduces only small • error when reconstructing the original data
Example -1 Employee Query: SELECTsalary FROM employee WHERE empid=5 Result: By using the synopsis [2.75,- 1.25, 0.5, 0, 0, 0, 0, 0] and constructing the tree on fly, salary=4 will be returned.Whereas the correct result is salary=3.This error is due to truncation of wavelength
Example-2 on range query • SELECT avg(salary) FROM Employee WHERE 3 < empid <7 • Keep the original data in form of cumulative dataset • Find the Haar wavelet transformation and construct the tree
Comparison with sampling • For Haar wavelet transformation all the data must be numeric. In the example, even empid must be numeric and must be sorted • Multidimension Haar wavelet transformation • Sampling gives the probabilistic error measure whereas Haar wavelet does not provide any • Haar wavelet is more robust than sampling. The final average gives the average of all data values. Hence all the tuples are involved.
AQP methods • Sampling- Most promising, robust (works on categorical and unsorted data too. • Histogram • Wavelet- have to reconstruct the tree • Join distributive model • Bayesian network
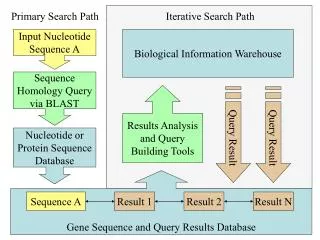
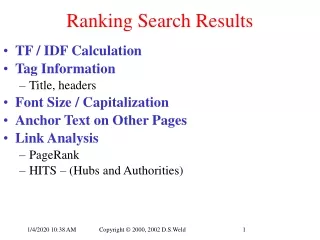
Ranking • Example 1- In Google, one gives the query (or search phrase) to database and a tuple (or page ) matching the search phrase is displayed • Example 2- In library catalog, one gives the partial information on a book, the top 10 books are ranked according to the matching requirements and are displayed • Query, reviews, reliability plays important role in ranking
Similarity function • Similarity function S(Q,t)= [0,1] where Q-query t-tuple. Bigger number means more appropriate to query • Using similarity function, one can execute query quickly • Apart from ranking ,summarization of the results can also be done. Eg. On typing jaguar in Google, website of jaguar cars and website of jaguar animal can be displayed
Example for ranking • Consider a search data engine to display top restaurants. Let cuisine, price and location be the attributes or the criteria under which restaurants are ranked • Assume the database to be numeric. Let Score(t)= 3.5 price+2.8 location+8.3 cuisine be the ranking function • Apply the ranking function to all tuples, find the score, sort the top score and print the result.
References • maids.ncsa.uiuc.edu/documents/readings/rastogi02.ppt