Download
1 / 14
140 likes | 372 Views
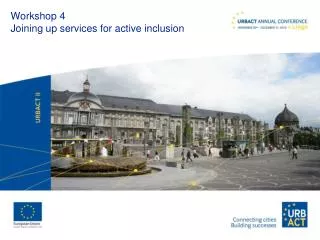
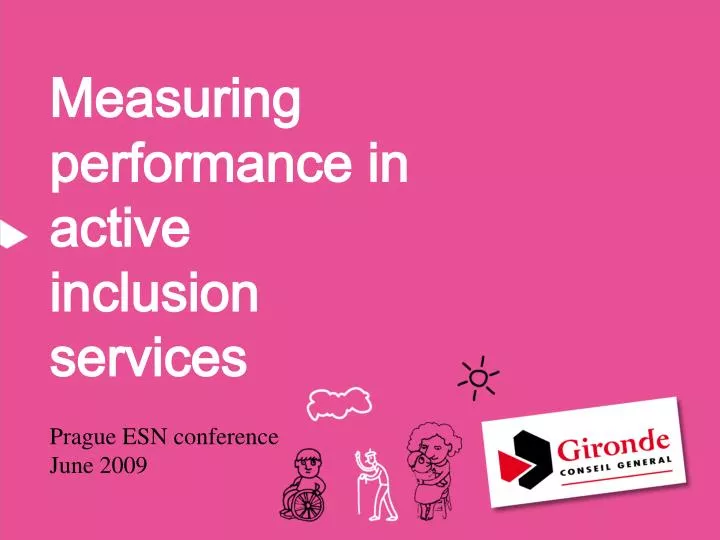
Measuring performance in active inclusion services Prague ESN conference June 2009 9 30 : The Gironde case The purpose Background Results ; 3 examples of action plans Future work Questions 10 00 : Discussion in small groups 10 35 : General discussion 10 50 : Summing up Outline

E N D
Measuring performance in active inclusion services Prague ESN conference June 2009
9 30 :The Gironde case The purpose Background Results ; 3 examples of action plans Future work Questions 10 00 :Discussion in small groups 10 35 :General discussion 10 50 :Summing up Outline
How to account for the efficiency of active inclusion services? The case of the Gironde Council : conceiving an action plan tool describing the different tasks to be carried out. Achieving transparency. The purpose
Background (1) ۰the debate on the efficiency of the active inclusion services ۰a team of advisors to assist the social services in Gironde
Background (2) ۰ the management requirements concerning the efficiency of our advisors ۰ the answer in terms of action plans
A first benefit : rationalizing the work Some adjustments to be done in 2009 to meet the ESF requirements and the management requirements separately . Global analysis remain to be done for 2007-2009. Conclusion and future work
Questions (1) ● Why are there so many grey squares in your diagrams? ● What are the global results? ● Are these diagrams used to account to the ESF managing authority? ● Did all the EIA really adapt themselves to these new action plan tools?
● Are there other similar experiments in France? ● Why to add other services to existing social services? • What do you mean when you say « to link inclusion offer and demand? • Hasn’t a new law on inclusion just been passed in France? Questions (2)
•What’s the state of the art as far as the measurement of the performance of active inclusion services in your country is concerned? Is it a requirement? • What do you think of the Gironde case? • Do you know other cases of good practice? Discussionin small groups