Download
1 / 51
510 likes | 757 Views
Online Science the New Computational Science. Jim Gray Microsoft Research http://research.microsoft.com/~gray Alex Szalay Johns Hopkins. Experiments & Instruments. facts. questions. facts. Other Archives. facts. answers. Literature. facts. ?. Simulations. Outline.

E N D
Online Sciencethe New Computational Science Jim GrayMicrosoft Research http://research.microsoft.com/~gray Alex Szalay Johns Hopkins
Experiments & Instruments facts questions facts Other Archives facts answers Literature facts ? Simulations Outline • The Evolution of X-Info – how CS can help • The World Wide Telescope as Archetype • How I work with them: a case study The Big Problems • Data ingest • Managing a petabyte • Common schema • How to organize it • How to reorganize it • How to coexist with others • Query and Vis tools • Integrating data and Literature • Support/training • Performance • Execute queries in a minute • Batch query scheduling
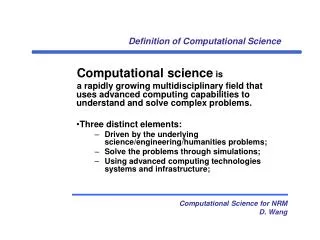
Evolving Science • Empirical Science • Scientist gathers data by direct observation • Scientist analyzes data • Analytical Science • Scientist builds analytical model • Makes predictions. • Computational Science • Simulate analytical model • Validate model and makes predictions • Science - Informatics • Data captured by instrumentsOr data generated by simulator • Processed by software • Placed in a database / files • Scientist analyzes database / files
Information Avalanche Image courtesy C. Meneveau & A. Szalay @ JHU • In science, industry, government,…. • better observational instruments and • and, better simulations producing a data avalanche • Examples • BaBar: Grows 1TB/day 2/3 simulation Information 1/3 observational Information • CERN: LHC will generate 1GB/s .~10 PB/y • VLBA (NRAO) generates 1GB/s today • Pixar: 100 TB/Movie • New emphasis on informatics: • Capturing, Organizing, Summarizing, Analyzing, Visualizing BaBar, Stanford P&E Gene Sequencer From http://www.genome.uci.edu/ Space Telescope
The Virtual Observatory • Premise: most data is (or could be online) • The Internet is the world’s best telescope: • It has data on every part of the sky • In every measured spectral band: optical, x-ray, radio.. • As deep as the best instruments (2 years ago). • It is up when you are up • The “seeing” is always great • It’s a smart telescope: links objects and data to literature • Software is the capital expense • Share, standardize, reuse..
ROSAT ~keV DSS Optical IRAS 25m 2MASS 2m GB 6cm WENSS 92cm NVSS 20cm IRAS 100m Why Is Astronomy Special? • Almost all literature online and public ADS:http://adswww.harvard.edu/CDS:http://cdsweb.u-strasbg.fr/ • Data has no commercial value • No privacy concerns, freely share results with others • Great for experimenting with algorithms • It is real and well documented • High-dimensional (with confidence intervals) • Spatial, temporal • Diverse and distributed • Many different instruments from many different places and many different times • The community wants to share the data • There is a lot of it (soon petabytes)
Time and Spectral DimensionsThe Multiwavelength Crab Nebulae Crab star 1053 AD X-ray, optical, infrared, and radio views of the nearby Crab Nebula, which is now in a state of chaotic expansion after a supernova explosion first sighted in 1054 A.D. by Chinese Astronomers. Slide courtesy of Robert Brunner @ CalTech.
Global Federations • Massive datasets live near their owners: • Near the instrument’s software pipeline • Near the applications • Near data knowledge and curation • Each Archive publishes a (web) service • Schema: documents the data • Methods on objects (queries) • Scientists get “personalized” extracts • Uniform access to multiple Archives • A common global schema Federation
Current science practice based on data download (FTP/GREP)Will not scale to the datasets of tomorrow You can GREP 1 MB in a second You can GREP 1 GB in a minute You can GREP 1 TB in 2 days You can GREP 1 PB in 3 years. Oh!, and 1PB ~5,000 disks At some point you need indices to limit searchparallel data search and analysis This is where databases can help You can FTP 1 MB in 1 sec You can FTP 1 GB / min (~1$) … 2 days and 1K$ … 3 years and 1M$ Data Access Hitting a Wall
Software for Instrument scheduling Instrument control Data gathering Data reduction Database Analysis Visualization Millions of lines of code Repeated for experiment after experiment Not much sharing or learning Let’s work to change this Identify generic tools Workflow schedulers Databases and libraries Analysis packages Visualizers … Experiment Budgets ¼…½ Software
Data Mining Algorithms Miners Scientists Science Data & Questions Database To store data Execute Queries Plumbers Question & AnswerVisualization Tools What’s X-info Needs from us (cs)(not drawn to scale)
Your program Web Server http Web page Your program Web Service soap Data In your address space objectin xml Web Services: Enable Federation • Web SERVER: • Given a url + parameters • Returns a web page (often dynamic) • Web SERVICE: • Given a XML document (soap msg) • Returns an XML document • Tools make this look like an RPC. • F(x,y,z) returns (u, v, w) • Distributed objects for the web. • + naming, discovery, security,.. • Internet-scale distributed computing • Now: Find object modelsfor each science.
New Approaches to Data Analysis • Looking for • Needles in haystacks – the Higgs particle • Haystacks: Dark matter, Dark energy • Needles are easier than haystacks • Global statistics have poor scaling • Correlation functions are N2, likelihood techniques N3 • As data and computers grow at same rate, we can only keep up with N logN • A way out? • Discard notion of optimal (data is fuzzy, answers are approximate) • Don’t assume infinite computational resources or memory • Requires combination of statistics & computer science From Alex Szalay
Analysis and Databases • Much statistical analysis deals with • Creating uniform samples – • data filtering • Assembling relevant subsets • Estimating completeness • Censoring bad data • Counting and building histograms • Generating Monte-Carlo subsets • Likelihood calculations • Hypothesis testing • Traditionally these are performed on files • Most of these tasks are much better done inside a database • Move Mohamed to the mountain, not the mountain to Mohamed. From Alex Szalay
SkyServer.SDSS.org • A modern archive • Access to Sloan Digital Sky SurveySpectroscopic and Optical surveys • Raw Pixel data lives in file servers • Catalog data (derived objects) lives in Database • Online query to any and all • Also used for education • 150 hours of online Astronomy • Implicitly teaches data analysis • Interesting things • Spatial data search • Client query interface via Java Applet • Query from Emacs, Python, …. • Cloned by other surveys (a template design) • Web services are core of it.
SkyQuery (http://skyquery.net/) • Distributed Query tool using a set of web services • Many astronomy archives from Pasadena, Chicago, Baltimore, Cambridge (England) • Has grown from 4 to 15 archives,now becoming international standard • WebService Poster Child • Allows queries like: SELECT o.objId, o.r, o.type, t.objId FROM SDSS:PhotoPrimary o, TWOMASS:PhotoPrimary t WHERE XMATCH(o,t)<3.5 AND AREA(181.3,-0.76,6.5) AND o.type=3 and (o.I - t.m_j)>2
Each SkyNode publishes Schema Web Service Database Web Service Portal is Plans Query (2 phase) Integrates answers Is itself a web service ImageCutout SkyQuery Portal 2MASS INT SDSS FIRST SkyQuery Structure
Experiments & Instruments facts questions facts Other Archives facts answers Literature facts ? Simulations Outline • The Evolution of X-Info – how CS can help • The World Wide Telescope as Archetype • How I work with them: a case study The Big Problems • Data ingest • Managing a petabyte • Common schema • How to organize it • How to reorganize it • How to coexist with others • Query and Vis tools • Integrating data and Literature • Support/training • Performance • Execute queries in a minute • Batch query scheduling
How to Help? • Can’t learn the discipline before you start(takes 4 years.) • Can’t go native – you are a CS person not a bio,… person • Have to learn how to communicateHave to learn the language • Have to form a working relationship with domain expert(s) • Have to find problems that leverage your skills
Working Cross-Culture How to Design the Database:Scenario Design • Astronomers proposed 20 questions • Typical of things they want to do • Each would require a week of programming in tcl / C++/ FTP • Goal, make it easy to answer questions • DB and tools design motivated by this goal • Implemented utility procedures • JHU Built Query GUI for Linux /Mac/.. clients
Q11: Find all elliptical galaxies with spectra that have an anomalous emission line. Q12: Create a grided count of galaxies with u-g>1 and r<21.5 over 60<declination<70, and 200<right ascension<210, on a grid of 2’, and create a map of masks over the same grid. Q13: Create a count of galaxies for each of the HTM triangles which satisfy a certain color cut, like 0.7u-0.5g-0.2i<1.25 && r<21.75, output it in a form adequate for visualization. Q14: Find stars with multiple measurements and have magnitude variations >0.1. Scan for stars that have a secondary object (observed at a different time) and compare their magnitudes. Q15: Provide a list of moving objects consistent with an asteroid. Q16: Find all objects similar to the colors of a quasar at 5.5<redshift<6.5. Q17: Find binary stars where at least one of them has the colors of a white dwarf. Q18: Find all objects within 30 arcseconds of one another that have very similar colors: that is where the color ratios u-g, g-r, r-I are less than 0.05m. Q19: Find quasars with a broad absorption line in their spectra and at least one galaxy within 10 arcseconds. Return both the quasars and the galaxies. Q20: For each galaxy in the BCG data set (brightest color galaxy), in 160<right ascension<170, -25<declination<35 count of galaxies within 30"of it that have a photoz within 0.05 of that galaxy. Q1: Find all galaxies without unsaturated pixels within 1' of a given point of ra=75.327, dec=21.023 Q2: Find all galaxies with blue surface brightness between and 23 and 25 mag per square arcseconds, and -10<super galactic latitude (sgb) <10, and declination less than zero. Q3: Find all galaxies brighter than magnitude 22, where the local extinction is >0.75. Q4: Find galaxies with an isophotal surface brightness (SB) larger than 24 in the red band, with an ellipticity>0.5, and with the major axis of the ellipse having a declination of between 30” and 60”arc seconds. Q5: Find all galaxies with a deVaucouleours profile (r¼ falloff of intensity on disk) and the photometric colors consistent with an elliptical galaxy. The deVaucouleours profile Q6: Find galaxies that are blended with a star, output the deblended galaxy magnitudes. Q7: Provide a list of star-like objects that are 1% rare. Q8: Find all objects with unclassified spectra. Q9: Find quasars with a line width >2000 km/s and 2.5<redshift<2.7. Q10: Find galaxies with spectra that have an equivalent width in Ha >40Å (Ha is the main hydrogen spectral line.) The 20 Queries Also some good queries at: http://www.sdss.jhu.edu/ScienceArchive/sxqt/sxQT/Example_Queries.html
Two kinds of SDSS data in an SQL DB(objects and images all in DB) • 100M Photo Objects ~ 400 attributes 400K Spectra with ~30 lines/ spectrum
An easy one: Q7: Provide a list of star-like objects that are 1% rare. • Found 14,681 buckets, first 140 buckets have 99% time 104 seconds • Disk bound, reads 3 disks at 68 MBps. Select cast((u-g) as int) as ug, cast((g-r) as int) as gr, cast((r-i) as int) as ri, cast((i-z) as int) as iz, count(*) as Population from stars group by cast((u-g) as int), cast((g-r) as int), cast((r-i) as int), cast((i-z) as int) order by count(*)
Then What? • 20 Queries were a way to engage • Needed spatial data library • Needed DB design • Built website to publish the data • Data Loading (workflow scheduler). • Pixel web service that evolved… • SkyQuery federation evolved… • Now focused on spatial data library. Conversion to SQL 2005 (put analysis in DB).
Alternate Model • Many sciences are becoming information sciences • Modeling systems needs new and better languages. • CS modeling tools can help • Bio, Eco, Linguistic, … • This is the process/program centric view rather than my info-centric view.
Experiments & Instruments facts questions facts Other Archives facts answers Literature facts ? Simulations Outline • The Evolution of X-Info – how CS can help • The World Wide Telescope as Archetype • How I work with them: a case study The Big Problems • Data ingest • Managing a petabyte • Common schema • How to organize it • How to reorganize it • How to coexist with others • Query and Vis tools • Integrating data and Literature • Support/training • Performance • Execute queries in a minute • Batch query scheduling
Call to Action • X-info is emerging. • Computer Scientists can help in many ways. • Tools • Concepts • Provide technology consulting to the commuity • There are great CS research problems here • Modeling • Analysis • Visualization • Architecture
References http://SkyServer.SDSS.org/http://research.microsoft.com/pubs/http://research.microsoft.com/Gray/SDSS/ (download personal SkyServer) • Data Mining the SDSS SkyServer DatabaseJim Gray; Peter Kunszt; Donald Slutz; Alex Szalay; Ani Thakar; Jan Vandenberg; Chris Stoughton Jan. 2002 40 p. • An earlier paper described the Sloan Digital Sky Survey’s (SDSS) data management needs [Szalay1] by defining twenty database queries and twelve data visualization tasks that a good data management system should support. We built a database and interfaces to support both the query load and also a website for ad-hoc access. This paper reports on the database design, describes the data loading pipeline, and reports on the query implementation and performance. The queries typically translated to a single SQL statement. Most queries run in less than 20 seconds, allowing scientists to interactively explore the database. This paper is an in-depth tour of those queries. Readers should first have studied the companion overview paper “The SDSS SkyServer – Public Access to the Sloan Digital Sky Server Data” [Szalay2]. • SDSS SkyServer–Public Access to Sloan Digital Sky Server DataJim Gray; Alexander Szalay; Ani Thakar; Peter Z. Zunszt; Tanu Malik; Jordan Raddick; Christopher Stoughton; Jan Vandenberg November 2001 11 p.: Word 1.46 Mbytes PDF 456 Kbytes The SkyServer provides Internet access to the public Sloan Digital Sky Survey (SDSS) data for both astronomers and for science education. This paper describes the SkyServer goals and architecture. It also describes our experience operating the SkyServer on the Internet. The SDSS data is public and well-documented so it makes a good test platform for research on database algorithms and performance. • The World-Wide TelescopeJim Gray; Alexander Szalay August 2001 6 p.: Word 684 Kbytes PDF 84 Kbytes • All astronomy data and literature will soon be online and accessible via the Internet. The community is building the Virtual Observatory, an organization of this worldwide data into a coherent whole that can be accessed by anyone, in any form, from anywhere. The resulting system will dramatically improve our ability to do multi-spectral and temporal studies that integrate data from multiple instruments. The virtual observatory data also provides a wonderful base for teaching astronomy, scientific discovery, and computational science. • Designing and Mining Multi-Terabyte Astronomy ArchivesRobert J. Brunner; Jim Gray; Peter Kunszt; Donald Slutz; Alexander S. Szalay; Ani ThakarJune 1999 8 p.: Word (448 Kybtes) PDF (391 Kbytes) • The next-generation astronomy digital archives will cover most of the sky at fine resolution in many wavelengths, from X-rays, through ultraviolet, optical, and infrared. The archives will be stored at diverse geographical locations. One of the first of these projects, the Sloan Digital Sky Survey (SDSS) is creating a 5-wavelength catalog over 10,000 square degrees of the sky (see http://www.sdss.org/). The 200 million objects in the multi-terabyte database will have mostly numerical attributes in a 100+ dimensional space. Points in this space have highly correlated distributions. • There Goes the Neighborhood: Relational Algebra for Spatial Data Search, • with Alexander S. Szalay, Gyorgy Fekete, Wil O’Mullane, Aniruddha R. Thakar, Gerd Heber, Arnold H. Rots, MSR-TR-2004-32, • Extending the SDSS Batch Query System to the National Virtual Observatory Grid,Maria A. Nieto-Santisteban, William O'Mullane, Jim Gray, Nolan Li, Tamas Budavari, Alexander S. Szalay, Aniruddha R. Thakar, MSR-TR-2004-12. Explains how the astronomers are building personal databases and a simple query scheduler into their astronomy data-grid portals.
? Experiments & Instruments facts questions facts Other Archives facts answers Literature facts Simulations Outline • New Science • Working cross disciplines • Data Demographics and Data Handling • Exponential growth • Data Lifecycle • Versions • Data inflation • Year 5 • Overprovision by 6x • Data Loading • Regression Tests • Statistical subset • Curation
Information Avalanche Image courtesy C. Meneveau & A. Szalay @ JHU • In science, industry, government,…. • better observational instruments and • and, better simulations producing a data avalanche • Examples • BaBar: Grows 1TB/day 2/3 simulation Information 1/3 observational Information • CERN: LHC will generate 1GB/s .~10 PB/y • VLBA (NRAO) generates 1GB/s today • Pixar: 100 TB/Movie • New emphasis on informatics: • Capturing, Organizing, Summarizing, Analyzing, Visualizing BaBar, Stanford P&E Gene Sequencer From http://www.genome.uci.edu/ Space Telescope
Q: Where will the Data Come From?A: Sensor Applications • Earth Observation • 15 PB by 2007 • Medical Images & Information + Health Monitoring • Potential 1 GB/patient/y 1 EB/y • Video Monitoring • ~1E8 video cameras @ 1E5 MBps 10TB/s 100 EB/y filtered??? • Airplane Engines • 1 GB sensor data/flight, • 100,000 engine hours/day • 30PB/y • Smart Dust: ?? EB/y http://robotics.eecs.berkeley.edu/~pister/SmartDust/ http://www-bsac.eecs.berkeley.edu/~shollar/macro_motes/macromotes.html
CERN Tier 0 Instruments: CERN – LHCPeta Bytes per Year Looking for the Higgs Particle • Sensors: ~1 GB/s (~ 20 PB/y) • Events 100 MB/s • Filtered 10 MB/s • Reduced 1 MB/sData pyramid: 100GB : 1TB : 100TB : 1PB : 10PB
Like all sciences, Astronomy Faces an Information Avalanche • Astronomers have a few hundred TB now • 1 pixel (byte) / sq arc second ~ 4TB • Multi-spectral, temporal, … → 1PB • They mine it looking fornew (kinds of) objects or more of interesting ones (quasars), density variations in 400-D space correlations in 400-D space • Data doubles every year • Data is public after 1 year • So, 50% of the data is public • Same access for everyone
Roche Center for Medical Genomics (RCMG): number of mass-spectra acquired for proteomics doubled every year since first mass spectrometer deployed. Moore’s Law in Proteomics Courtesy of Peter Berndt, Roche Center for Medical Genomics (RCMG) R2=0.96
Level 1 calibrated Level 0 raw Level 2 derived instrument or simulator pipeline pipeline other data other data Data Lifecycle • Raw data → primary data → derived data • Data has bugs: • Instrument bugs • Pipeline bugs • Data comes in versions • later versions fix known bugs • Just like software (indeed data is software) • Can’t “un-publish” bad data.
Level 1AGrows X TB/year ~ .4X TB/y compressed (level 1A in NASA terms) Level 2Derived data products ~10x smaller But there are many. L2≈L1 Publish new edition each year Fixes bugs in data. Must preserve old editions Creates data pyramid Store each edition 1, 2, 3, 4… N ~ N2 bytes Net: Data Inflation: L2 ≥ L1 Level 1A 4 editions of 4 Level 2 products E4 E3 E2 time E1 4 editions oflevel 1A data(source data) 4 editions of level 2 derived data products. Note that each derived product is small, but they are numerous. This proliferation combined with the data pyramid implies that level2 data more than doubles the total storage volume. Data Inflation – Data Pyramid
The Year 5 Problem • Data arrives at R bytes/year • New Storage & Processing • Need to buy R units in year N • Data inflation means ~N2R • Need to buy NR units • Depreciate over 3 years • After year 3 need to buy N2R + (N-3)2R • Moore’s law:60%/year price decline • Capital expense peaks at year 5 • See 6x Over-Power slide next
3.6TB PubDB 1.8TB DR2C 1.8TB DR2M 1.8TB DR2P 2.4TB DR3C 2.4TB DR3M 2.4TB DR3P 6x Over-Power Ratio • If you think you need X raw capacity, then you probably need 6X • Reprocessing • Backup copies • Versions • … • Hardware is cheap, Your time is precious.
Data Loading • Data from outside • Is full of bugs • Is not in your format • Advice • Get it in a “Universal Format” (e.g. Unicode CSV) • Create Blood-Brain barrier Quarantine in a “load database” • Scrub the data • Cross check everything you can • Check data statistics for sanity • Reject or repair bad data • Generate detailed bug reports(needed to send rejection upstream) • Expect to reload many times Automate everything!
Performance Prediction & Regression • Database grows exponentially • Set up response-time requirements • For load • For access • Define a workload to measure each • Run it regularly to detect anomalies • SDSS uses • one-week to reload • 20 queries with response of 10 sec to 10 min.
Data Subsets For Science and Development • Offer 1GB, 10GB, …, Full subsets • Wonderful tool for you • Debug algorithms • Good tool for scientists • Experiment on subset • Not for needle in haystack, but good for global stats • Challenge: How make statistically valid subsets? • Seems domain specific • Seems problem specific • But, must be some general concepts.
? Experiments & Instruments facts questions facts Other Archives facts answers Literature facts Simulations Outline • New Science • Working cross disciplines • Data Demographics and Data Handling • Curation • Problem statement • Economics • Astro as a case in point
Problem Statement • Once published, scientific data needs to be available forever,so that the science can be reproduced/extended. • What does that mean? • Data can be characterized as • Primary Data: could not be reproduced • Derived data: could be derived from primary data. • Meta-data: how the data was collected/derivedis primary • Must be preserved • Includes design docs, software, email, pubs, personal notes, teleconferences, NASA “level 0”
The Core Problem: No Economic Model • The archive user is not yet born. How can he pay you to curate the data? • The Scientist gathered data for his own purposeWhy should he pay (invest time) for your needs? • Answer to both: that’s the scientific method • Curating data(documenting the design, the acquisition and the processing)Is difficult and there is little reward for doing it.Results are rewarded, not the process of getting them. • Storage/archive NOT the problem (it’s almost free) • Curating/Publishing is expensive,MAKE IT EASIER!!! (lower the cost)
Publishing Data Roles Authors Publishers Curators Archives Consumers Traditional Scientists Journals Libraries Archives Scientists Emerging Collaborations Project web site Data+Doc Archives Digital Archives Scientists
Changing Roles • Exponential growth: • Projects last at least 3-5 years • Project data online during project lifetime. • Data sent to central archive only at the end of the project • At any instant, only 1/8 of data is in central archives • New project responsibilities • Becoming Publishers and Curators • Larger fraction of budget spent on software • Standards are needed • Easier data interchange, fewer tools • Templates are needed • Much development duplicated, wasted
What SDSS is Doing: Capture the Bits(preserve the primary data) • Best-effort documenting data and processDocuments and data are hyperlinked. • Publishing data: often by UPS(~ 5TB today and so ~5k$ for a copy) • Replicating data on 3 continents. • EVERYTHING online (tape data is dead data) • Archiving all email, discussions, …. • Keeping all web-logs & query logs. • Now we need to figure out how to organize/search all this metadata.
Schema (aka metadata) • Everyone starts with the same schema <stuff/>Then the start arguing about semantics. • Virtual Observatory:http://www.ivoa.net/ • Metadata based on Dublin Core:http://www.ivoa.net/Documents/latest/RM.html • Universal Content Descriptors (UCD): http://vizier.u-strasbg.fr/doc/UCD.htxCaptures quantitative concepts and their unitsReduced from ~100,000 tables in literature to ~1,000 terms • VOtable – a schema for answers to questionshttp://www.us-vo.org/VOTable/ • Common Queries:Cone Search and Simple Image Access Protocol, SQL • Registry: http://www.ivoa.net/Documents/latest/RMExp.htmlstill a work in progress.
New Science X-Info for all fields X WWT as an example Big Picture Puzzle Hitting the wall Needle in haystack Move queries to data Working cross disciplines How to help? 20 questions WWT example Alt: CS Process Models Data Demographics Exponential growth Data Lifecycle Versions Data inflation Year 5 is peak cost Overprovision by 6x Data Loading Regression Tests Statistical subset Curation Problem statement Economics Astro as a case in point Summary
Call to Action • X-info is emerging. • Computer Scientists can help in many ways. • Tools • Concepts • Provide technology consulting to the community • There are great CS research problems here • Modeling • Analysis • Visualization • Architecture