Download
1 / 27
290 likes | 600 Views
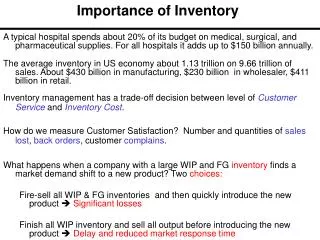
Importance of Inventory. Typically the largest asset on balance sheet High inherent risk Net realizable value Complex calculations Importance of physical observation. F.G. Inventory Beg. Inventory 3. Transfer from 4. Transfer to Cost WIP (Purchases) of Sales

E N D
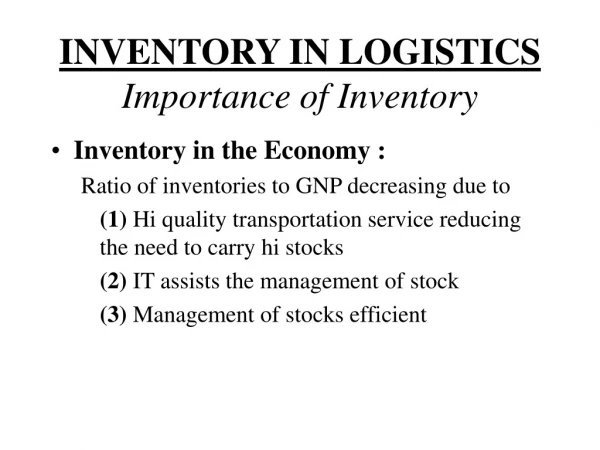
Importance of Inventory • Typically the largest asset on balance sheet • High inherent risk • Net realizable value • Complex calculations • Importance of physical observation
F.G. Inventory • Beg. Inventory • 3. Transfer from 4. Transfer to Cost • WIP (Purchases) of Sales • (BTP if count 6. Physical • > books) inventory • adjustment • Ending Inventory
Cost of Sales • 4. COS - Transfer • from FG • 5. Underapplied (overapplied) • overhead • 6. Book to (BTP adj. if count • physical inventory > books) • adjustment
Analytical ProceduresGross Margin • Convert change in ratio to dollars • Trends - look at changes in ratio over time considering industry, expectations • Disaggregate data • Use turnover as supporting information • (inventory turnover is primarily used to assess net realizable value)
Disaggregation Example • OtherShoes Shoes Total Total • Sports Rep. Corr. Rep. Corr. • Sales 10,000 5,000 5,000 15,000 15,000 • COS 6,000 3,000 3,200 9,000 9,200 • GM 4,000 2,000 1,800 6,000 5,800 • GM% 40% 40% 36% 40% 38.7%
Explanations for Increase in GP • Error Non-error explanations explanations
Explanations for Increase in GP • Error Non-error explanations explanations • Sales cutoff Mix change • Purchase cutoff Price increase • Fictitious sale Cost decrease • Inventory • misstated
MC • Substantive tests for inventories include comparison to prior years, budgets, and industry averages. Which of the following would cause an abnormally low gross profit rate? • a. Overstatement of ending inventory. • b. Overstatement of sales. • c. Understatement of ending inventory. • d. Overstatement of variable selling costs.
Problem 21-29 Part a: • 2009 2008 2007 2006 • Gross Margin % 26.3 22.6 22.4 22.4 • Inventory • Turnover6.6 7.6 7.6 7.9 • Turnover computed as COS/Ave. Inv • 2009 2008 • Sales 23.2 21.7 • COS 17.1 16.8 • EI 2.9 2.3
Prob. 21-29 - Part c: • Materiality of change in gross profit: • Materiality of change in turnover:
Part c: • Change in gross profit x sales = • 3.7% x 23.2 million = $858,000 • 2009 CGS / 2008 turnover = • 17.1 million / 7.6 = 2.25 million EI. • 2009 EI - estimated based on 2008 turnover = 2.9 million - 2.25 million = $650,000. • The possible misstatement indicated by each ratio is material.
Part b: • Logical causes of increase in gross profit for 2009: • Logical causes of decrease in inventory turnover:
Part b: • Logical causes of increase in gross profit for 2009: • 1. Increase in sales price. • 2. Change in inventory method. • 3. Improper sales cutoff (2010 sale recorded in 2009), or purchase cutoff error (2009 purchases recorded in 2010). • 4. Change in sales mix. • 5. Overstated inventory
Logical causes of decrease in inventory turnover: • 1. Increase in selling prices also lowered demand for product. • 2. Company building inventory supplies. • 3. Change in inventory method • 4. Increase in obsolete or unsalable inventory. • 5. Overstated inventory.
Physical Inventory Observation • Required by SAS # 1 • Client controls are important
Inventory Observation • Physical inventory can be taken off year-end • Client should not know exact locations to be visited • No year-end physical is necessary if client has adequate perpetual records • Cycle counts should be taken to test accuracy of perpetual records
Inventory Tags • Evidence that inventory was counted (completeness) • Record for internal verification • Prenumbered document facilitates existence test
Test Counts • Client should not know items selected • Record quantity, description and unit of measure • control sequence of tags (critical control of existence)
Perpetual System • Counts perpetual records • Counts perpetual records • Which is the existence test?
Direction of Tests • Counts perpetual records Completeness • Counts perpetual records • Existence
Existence for Physical Inventory • Valid tags • Reasonable quantities • Test counts agree • Analytical Procedures • Key point: can’t test from records to inventory, unless a detailed inventory listing exists
The physical count for a retailer is higher than the perpetual records. Which of the following could explain the difference? • Inventory items had been counted but the tags had not been removed and added to the compilation sheets. • Credit memos for returned goods had not been recorded. • No journal entry had been made for goods returned to suppliers. • An item purchased FOB shipping pt. had not arrived and was not in the perpetual records.
Inventory Compilation • Tags should be valid tag sequences noted during observation (existence) • Test summarization of quantities, price extensions, and summary value should equal trial balance/adjusted general ledger (detail tie-in) • Scan entire listing for reasonableness of quantities, prices, extensions
Inventory Pricing • Usually priced at FIFO initially • LIFO recorded in a reserve account based on calculations • Client may use both methods
Additional Pricing Issues • Layering- Goods may have been purchased as several prices. • Obsolescence (LCM) - Primarily determined by movement and prices of goods. • Manufacturing overhead - Over/underapplied overhead usually closed to COS. If material, some relates to ending inventory.
Sales Cutoff • January sale ($10,000; GP = 25%) recorded in December • Goods included in Goods excluded from • inv. (phys. taken) inv. (perp. system) • Sales 10,000Sales 10,000 • Inv. 7,500 • AR 10,000 AR 10,000 • COS 7,500
Purchases Cutoff • December purchase of $10,000 recorded in January • Goods included in Goods excluded from • inv. (phys. taken) inv. (perp. system) • COS 10,000Inv. 10,000 • Accts. Pay 10,000 Accts. Pay. 10,000