Download
1 / 13
130 likes | 666 Views
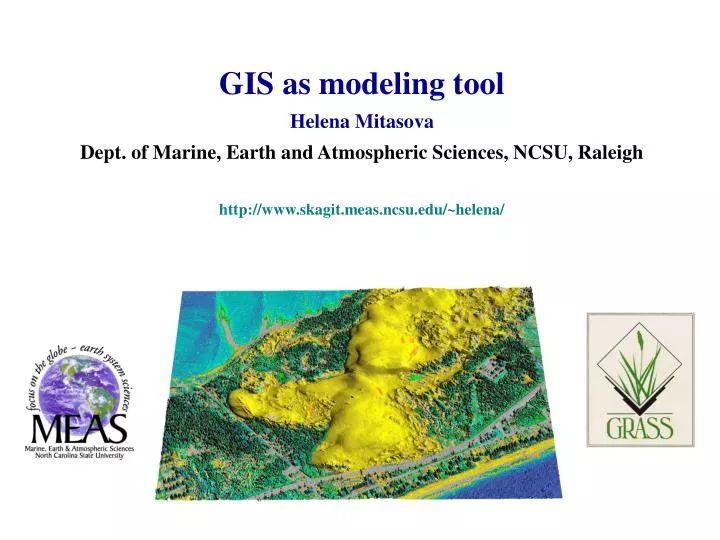
GIS as modeling tool Helena Mitasova Dept. of Marine, Earth and Atmospheric Sciences, NCSU, Raleigh http://www.skagit.meas.ncsu.edu/~helena/.

E N D
GIS as modeling tool Helena Mitasova Dept. of Marine, Earth and Atmospheric Sciences, NCSU, Raleigh http://www.skagit.meas.ncsu.edu/~helena/
US Dept. of Labor identified geotechnology as one of the three most important emerging and evolving fields, along with nanotechnology and biotechnology." Nature, vol. 427, Jan. 2004, p. 376. New trends * Revolution in mapping technologies (laser scanning, multispectral imagery...) * Automated monitoring stations: meteorology, oceanography, surface water (Rivernet, USGS, DOT), groundwater, etc. * On-line distribution of data, near real time data availability, WebGIS * Multidimensional dynamic GIS: replacement of 2D static representation of landscape by a 3D dynamic representation; H. Mitasova
GIS technology and landscape processes Monitoring modern mapping technologies – LIDAR, IFSARE, multispectral imagery, RTK-GPS, automated sensors Analysis and risk assessment integration of data from multiple sources, spatial analysis, visualization : identifying the problem areas, trends, risks Prediction of impacts spatially distributed numerical modeling, simulations Planning and decision support information and tools for management of natural and socio-economic resources H. Mitasova
Jockey's Ridge State Park Established in 1975 to save the dunes, it was believed to be stable. It is now completely surrounded by development and it migrates faster than expected, threatening nearby homes and roads Challenge: keep the naturally migrating dune within the park 2003 view from NE H. Mitasova
Jockey's Ridge evolution 1974 and 1995 photogrammetric data courtesy Dr. Overton, NCSU 1999 ATM lidar: USGS/NASA/NOAA N D A 1974 (brown) 1995 (yellow) migration rate: 3m/y 1995 (yellow) 1999 (red) migration rate: 7m/y H. Mitasova
Jockey’s Ridge: 1998 DOQQ, 1999 LIDAR, 2002 RTK-GPS 1. East ridge needs immediate attention as it is moving fast towards the road 2. The fences in Central section work as elevation there increases 3. Main ridge is rapidly flattening and moves fast SW sand pavement vegetation H. Mitasova
Jockey’s Ridge evolution: natural + man-made Dune rolled over minigolf N C 2002 2003 2000 winter 2003 “Nature tries to shift OB but man keeps shoveling it back” Cornelia Dean, NYT Sept. 22 H. Mitasova
Development of SW Centennial Campus Combining the GIS and CAD data to create digital models of the current and future landscapes 2001 1993 future construction
Pre-development 1993 overland flow and location of sediment control structures future school location constructed wetland check dams detention area previously a NCSU farm
Overland flow and net erosion/deposition discharge m3/s /m2s 0.7m3/s 0.01-6.0kg/ms erosion=968kg/s 0.002m3/s 0.001kg/ms erosion=87kg/s erosion deposition main impact of disturbance is outside construction site: stream erosion within protective buffer
Overland flow and net erosion/deposition impact of disturbance caused by concentrated water flow that is not sufficiently reduced by the buffer, maximum erosion rates are within the protective buffer Discharge m3/s Extended, high infiltration buffers can reduce the impact /m2s Erosion deposition Erosion 142kg/s compared to 968kg/s
Tangible GIS MIT media Laboratory
Tangible GIS MIT media laboratory


![Data Modeling [Comparison of data modeling techniques ]](https://cdn0.slideserve.com/205866/data-modeling-comparison-of-data-modeling-techniques-dt.jpg)