Download
1 / 46
700 likes | 1.93k Views
Nickel-base Superalloy Welding S. A. David & S. S. Babu Metals and Ceramics Division Oak Ridge National Laboratory Oak Ridge, TN 37831-6096 Departmental Seminar Outline Background Experimental Alloys Weld Cracking Monitoring of weld cracks Welding Process Parameters on Weld Cracking

E N D
Nickel-base Superalloy Welding S. A. David & S. S. Babu Metals and Ceramics Division Oak Ridge National LaboratoryOak Ridge, TN 37831-6096 Departmental Seminar
Outline • Background • Experimental Alloys • Weld Cracking • Monitoring of weld cracks • Welding Process Parameters on Weld Cracking • Fusion Zone Grain Development • Microstructure Development • Eutectic Reactions • Solid State Decomposition During Weld Cooling • Numerical Modeling • Future Directions • Summary and Conclusions
Significant breakthroughs have taken place in alloy design and processing of nickel based superalloys to meet the demands on turbine airfoils which operate at high temperatures. These include: • Directionally solidified alloys and single crystals • Single crystals for land-based turbine engines
Economical reuse and reclamation of used and failed directionally solidified and single-crystal blades are necessary. • Poor weldability and strength of nickel based superalloy welds have remained a critical issue. • Welding of single crystals: necessary to develop process and process parameters. air craft engine blade land based turbine engine blades
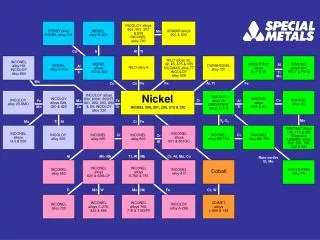
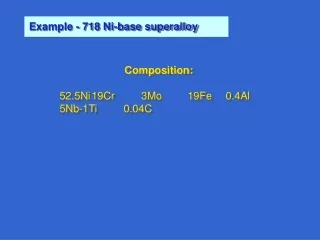
Experimental • Alloys (2- 3 mm single crystal thick sheets) • PWA1480: Ni - 5.0Al - 10.0Cr - 1.5Ti - 5.0Co - 12.0Ta - 4.0W (wt.%) • CMSX4: Ni - 5.5Al - 6.5Cr - 1.1Ti - 7.0Co - 7.0Ta - 6.5W (wt.%) (small amounts of Mo and Re) • Welding procedure • Electron Beam Welding (EB): • accelerating voltage: 100-125 kV • beam current: 7.5-10 mA, and • welding speed: 4.2 x 10⁻³ to 42 x 10-3 m s- 1 • Pulsed Laser Beam(PL): • average power: 90-240 W • pulse rate: 30 - 100 s-1 • welding speed : 2.1 10-3 (low) to 12.6 10-3 ms-1 (high) • Some of the welds were made with preheat of 500 °C • Characterization • Optical, Transmission electron and Atom-Probe Field-Ion microscopy • Vision-systems crack monitoring and modeling e-beam z x y
It is possible to monitor the weld cracking in real time. • “Vision-Systems” applies stroboscopic light to record the weld surface features. • The monitoring location was found out by trial and error.
Vision-system: Weld crack monitoring • Fixed or moving location can be monitored by this setup.
Effect of Welding and Welding Process Parameters on Weld Cracking
Most of the PWA-1480 single-crystal electron beam welds showed cracks. • There was no effect of weld orientation on weld cracking. • The weld cracking tendency was reduced by applying preheat of 500°C at low speeds. Transverse section Top Surface
Preheating reduced the cracking problem at low speeds in both EB welds.
Structure of PWA-1480 single crystal laser welds Top Surface Welding Speed: 12.6 mm/s Welding Speed: 16.8 mm/s Welding Speed: 25.2 mm/s
Preheating, low welding speeds, and moderate pulse rate reduced the cracking in LB welds.
(110) Surface - [111] Weld Using a geometric analysis and expressing the solidification front normal and the crystallographic growth directions in terms of a fixed set of reference axes, dendrite growth selection process can be calculated. • Future work: • Growth competition (Vitek, David and Boatner) (001) Surface - [100] Weld
weld region consists of three distinct dendrite-growth directions and “stray” crystals. • This is due to epitaxial solidification from the single-crystal base metal. • Stray crystals were associated with weld cracks.
Geometric model agrees with the experimentally observed dendrite-growth directions. • However, modification of the model is necessary to handle the “stray” crystal formation. • Stray crystal formation is attributed to constitutional supercooling.
Weld metal microstructure revealed the presence of inter-dendritic phase that has been identified as ´ eutectic with laves phase.
TEM revealed ´ precipitates inside primary dendrites and eutectic´ along the dendritic boundaries. • Size of ´ precipitates varied from ~0.05 to 0.5 µm. • Average volume percentage of ´ was 75%.
Atom Probe Field Ion Microscopy • Combination of Field Ion Microscope and Time of Flight Mass Spectrometer.
´ 1 2 3 NiNiNiNiNi....CrCrCr...AlAlAl..WWWWNiNiNiNiNI..AlAlAlAl..TaTaTaTaTa.AlAlAlAlAlNiNiNiNiNiNiNiNiNi....W CrCrCrCrReReReRe...Ni...NiCrCrCrNiNiNiNiNiNiNiNiAlAlNiNiNiNiNi....Ta APFIM Data Analysis • Successive evaporated ions are identified and recorded. • The variation of detected number of a particular ion with respect to total number of detected ions gives the concentration profile. 1 2 Boundary 3 Cylinder of Analysis
APFIM concentration profile from PWA1480 welds shows no segregation at -´ interface. • Not much difference in the composition of and ´phases compared to published results.
500 nm low-speed laser welds 50 nm In certain cases, the conventional microstructural development can be drastically altered. For example CMSX-4 pulsed laser welds. • Very little interdendritic eutectic ´ phases were observed • Fine L12 - ordered irregularly shaped ´ phases (~75%) were observed.
Extensive concentration gradients were observed inside the phase in CMSX4 welds. • Leads to changes in calculated lattice misfit. • This necessitates further investigation.
Comparison of lattice misfit at -´ interface in laser welds and in single-crystal base metal. • Lattice misfit % = 100 (a - a´)/[ (a + a´)/2 ] • aa´ are the lattice parameter of and ´ phases. • Lattice misfit in laser welds is positive compared to that of negative value in the single-crystal base metal. • will influence the microstructural evolution during PWHT and service
Numerical Modeling of Single-Crystal Ni-base Superalloy Welds
Sub-solidus crack formation in a stressed weldment was observed. • Weld cracks in M738 (~IN738) was transverse in nature. • The cracking is attributed to the presence of low-melting eutectics and the presence of longitudinal stress. Welding Direction
Complex stress patterns in the welds may lead to longitudinal and transverse cracks. • The presence of mechanical driving force and weak microstructure will lead to weld cracking. • The above work is supported by crack monitoring results. Feng, et. al. 1996 Uncoupled Finite Element Model
1 µm Ni-Al-Cr quasi-binary phase diagram suggests a eutectic reaction during final stages of weld solidification. • Calculated with ThermoCalc™ software. • The calculations are in agreement with the experimental observations. 1 µm
Eutectic reaction in Ni-Al-Cr alloy was simulated using DicTra® software. 100 °C / s 10 °C / s • Slow cooling leads to higher enrichment at liquid/ interface. • Qualitatively supported by the CMSX-4 results. • Must extend to multicomponent phase equilibrium calculations.
In this work, the phase transformations and microstructure development were investigated under controlled cooling conditions. • CM247DS alloy was investigated. Ni - 5.5% Al - 8.0% Cr - 0.8% Ti - 9.0% Co - 3.2% Ta - 9.5% W (wt.%) • Samples were continuously cooled from the solutionizing temperature of 1300°C (5min) at different rates in a Gleeble® thermomechanical simulator. • Transmission Electron Microscopy and Atom Probe Field Ion Microscopy were used for microstructure characterization. • Thermodynamic and Diffusion Controlled Growth Calculations were used to describe the microstructure evolution during welding.
Transformation strains measured with dilatometry showed complex behavior. • No established method to interpret this data without prior knowledge of thermal expansion and specific volume of the precipitating phases.
1 °C/s BM 0.17 °C/s Microstructure development during slow cooling was similar to that of base metal microstructure. • Micrographs are taken from same zone axis [001]. • Coarsening stage was reached in the sample cooled at 0.17°C/s. • Samples cooled at 1 •C/s showed some secondary g´ precipitates.
75 °C/s Water Quench 10 °C/s Number density of ´ precipitates increased with an increase in cooling rate from 1300°C. • Change is more dramatic on water-quenching the sample. • The change in g´ shape from cuboidal to irregular with increase in cooling rate was observed.
Chromium atom image obtained from atom probe tomography revealed both g matrix and g´ precipitates. g g´ • The above data was further analyzed to evaluate the morphology of g´ precipitates and elemental partitioning characteristics.
Interconnected g´ and distinct g´ precipitates were observed based on 15 at.% Cr surfaces. • Thin g regions in between the interconnected g´ were not enriched in chromium and the reasons for this are unclear.
Atom probe tomography from samples cooled at 75 °C/s failed to show any interconnected g´ precipitate morphology • Is it model the above precipitation characteristics using computational thermodynamics and kinetics modeling? Al Cr
Thermodynamic calculations allow us to predict the formation of g´precipitates. Equilibrium Diagram • ThermoCalc™ with Thermotech Ni-Fe™ data base was used. • To consider the kinetic effects, diffusion controlled growth calculations were used.
g´ g Diffusion controlled growth calculations predict the kinetics of g´ formation during cooling at 500°C/s from 1300°C. • The decomposition of g occurs rapidly below 1090°C. • Calculations are sensitive to inter-particle spacing and therefore need to be modified for different conditions.
Simulated concentration profiles are compared with the measured APFIM concentration profiles. • The magnitude of the calculated concentration gradients are different than the measured values.
Experimental and modeling results are necessary to design welding process parameters and post weld heat treatment conditions. • Nonequilibrium composition may lead to redistribution during heat treatment and/or service. • Partitioning characteristics control the lattice-misfit between g and g´ precipitates. • Lattice-misfit controls the creep resistance properties during service.
Future Directions • Ultimately, a generalized process model should be based on a coupled thermomechanical, and microstructural models.
Summary and Conclusions • Weld cracking in nickel based superalloys were reduced by preheating and low welding speed. • Fusion zone structure development can be predicted using geometric models. • Stray crystals were found to be associated with weld cracking and the formation of stray crystals was related to constitutional supercooling. • Eutectic ´ was observed along dendritic boundary. • Rapid weld cooling leads to large concentration gradients within the phase. • Numerical modeling needs to incorporate coupled thermomechanical, and metallurgical models.