Download
1 / 10
100 likes | 213 Views
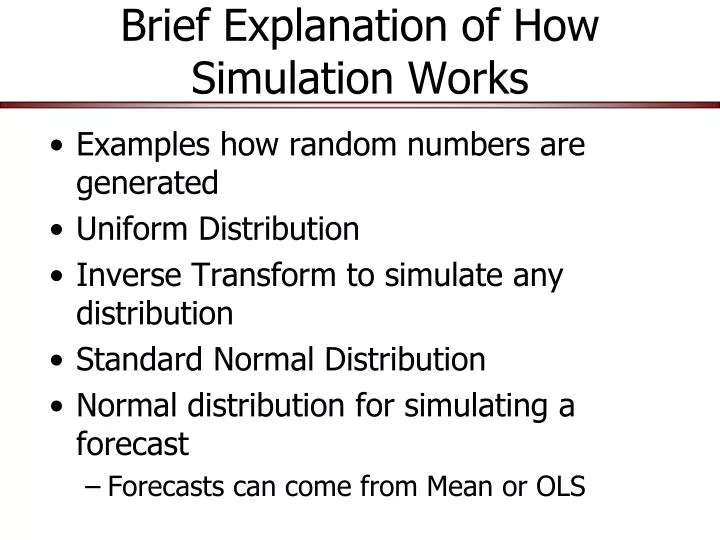
Brief Explanation of How Simulation Works. Examples how random numbers are generated Uniform Distribution Inverse Transform to simulate any distribution Standard Normal Distribution Normal distribution for simulating a forecast Forecasts can come from Mean or OLS. Step 1 for Simulation.

E N D
Brief Explanation of How Simulation Works • Examples how random numbers are generated • Uniform Distribution • Inverse Transform to simulate any distribution • Standard Normal Distribution • Normal distribution for simulating a forecast • Forecasts can come from Mean or OLS
Step 1 for Simulation • Generate a Uniform Standard Deviate (USD) =UNIFORM(0,1) Simetar simulates 500 values These are called iterations They are 500 samples or draws • Equal chance of observing a number in each of the intervals; both charts are for the same output
USD Output in SimData • Simetar saves the 500 samples in SimData and calculates summary statistics
Step 2 in Simulation • Use the 500 USDs to simulate random variables for your Ŷ variable • This involves translating the USDs from a 0 to 1 scale to the scale for your random variable • This is done using the Inverse Transform method shown on the next slide.
Step 2 Inverse Transform • The 500 USDs are converted from 0 to 1 scale to the Y scale by direct interpolation • Each random USD is associated with a unique “random” Y value to get 500 Ỹs
Step 2 Inverse Transform Cont. • Results of 500 iterations for Y using Inverse Transform • USDs and their resulting Ỹs
Step 3 Simulate Normal Distribution • Parameters for a Normal Distribution • Mean or Ŷ from OLS • StdDev or σ of residuals • Simulated using the formula Ỹ = Ŷ + σ * SND Where the SND is a “standard normal deviate” We generate 500 SNDs and thus simulate (calculate) 500 random Y’s
Step 3 Generating SNDs • Generate 500 USDs and transform them to SNDs using the Inverse Transform • SND’s have mean of Zero and range from ≈ +/- ∞ • SNDs are the “number of standard deviations from the mean” or the number of σ’s Ỹ is from the Ŷ or Ῡ
Step 3 Simulate Normal Distribution • Next apply the random SNDs in the Normal distribution formula Ỹ = Ŷ + σ * SND In Simetar all of these steps are done for you: =NORM(Ŷ, σ) or = NORM(Ŷ, σ, USD) • Next problem is where to get Ŷ and σ ? • In forecasting we estimate Ŷ = a + bX1 +bX2 or another OLS equation σ = Std Deviation of residuals
Normal Distribution: Simetar Code and Output • The USD is used to calculate the SND • The SND is used to simulate Y-Tilda • Simetar gives same result in one step