Download
1 / 6
70 likes | 174 Views
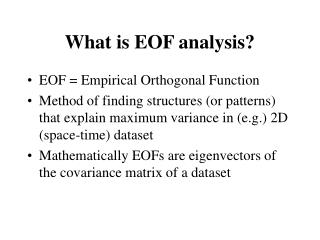
EOF ANALYSIS. Means of examining variations in beach profiles in a compact fashion Describes data variability in terms of orthogonal functions or statistical modes No direct physical or mathematical relationship necessarily exists between EOFs and actual processes. EOF ANALYSIS.

E N D
EOF ANALYSIS • Means of examining variations in beach profiles in a compact fashion • Describes data variability in terms of orthogonal functions or statistical modes • No direct physical or mathematical relationship necessarily exists between EOFs and actual processes
EOF ANALYSIS Eigenfunctions found from Where A is the data correlation matrix normalized by the dimensions of the data, e are eigenvectors and λ’s are eigenvalues (a standard eigenvalue problem) Total variance is Where C are the coefficients, I and K are dimensions of the data matrix and σ2 is the variance squared Importance of each ordered eigenfunction is found from
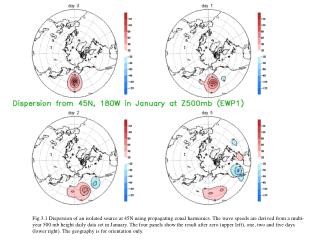
EOF ANALYSIS BY WINANT ET AL From Dean and Dalrymple; original source, Winant et al, 1975, JGR.
EXAMPLE AT DUCK, NC; SEPT/OCT, 1994 Data provided by the FRF and gridded by Nathaniel Plant
EXAMPLE AT DUCK, NC; SEPT/OCT, 1994 Data provided by the FRF and gridded by Nathaniel Plant
PERFORM EOF ANALYSIS ON DUCK DATA 2nd eigenfunction λ1 ~ 99.9 % λ2 ~ 0.08 % λ3 ~ 0.008 % 3rd eigenfunction 10 -109.5 Temporal Variation in Coefficients 5 -110 0 -110.5 -5 1st 2nd 3rd