Download
1 / 16
160 likes | 362 Views
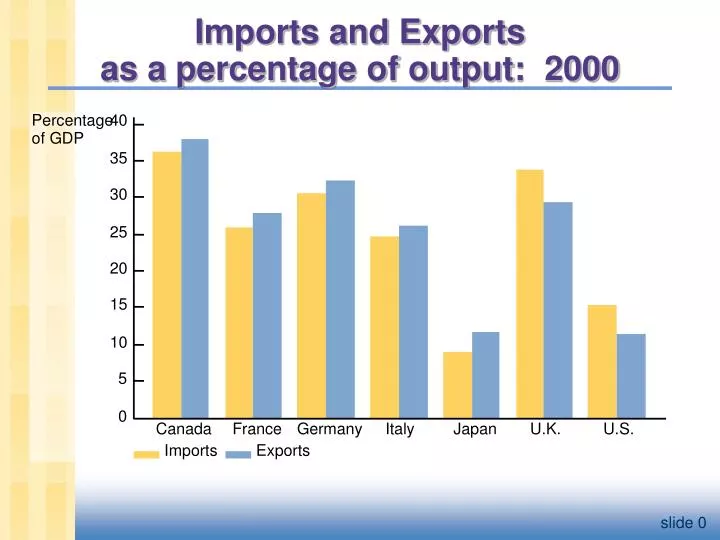
Imports and Exports as a percentage of output: 2000. Percentage. 40. of GDP. 35. 30. 25. 20. 15. 10. 5. 0. Canada. France. Germany. Italy. Japan. U.K. U.S. Imports. Exports. Three experiments. 1. Fiscal policy at home 2. Fiscal policy abroad

E N D
Imports and Exports as a percentage of output: 2000 Percentage 40 of GDP 35 30 25 20 15 10 5 0 Canada France Germany Italy Japan U.K. U.S. Imports Exports
Three experiments 1. Fiscal policy at home 2. Fiscal policy abroad 3. An increase in investment demand
r NX2 NX1 Results: I(r) S, I I1 1. Fiscal policy at home An increase in G or decrease in T reduces saving.
Budget deficit(right scale) Net exports(left scale) NX and the Government Budget Deficit
r NX2 NX1 I(r) S, I 2. Fiscal policy abroad Expansionary fiscal policy abroad raises the world interest rate. Results:
r S NX1 I(r)1 S, I I1 3. An increase in investment demand EXERCISE: Use the model to determine the impact of an increase in investment demand on NX, S, I, and net capital outflow.
r S NX2 NX1 I(r)2 I(r)1 S, I I2 I1 3. An increase in investment demand ANSWERS: I > 0, S = 0, net capital outflows and net exports fall by the amount I
Four experiments 1. Fiscal policy at home 2. Fiscal policy abroad 3. An increase in investment demand 4. Trade policy to restrict imports
ε ε2 ε1 NX(ε) NX NX1 NX2 1. Fiscal policy at home A fiscal expansion reduces national saving, net capital outflows, and the supply of dollars in the foreign exchange market… …causing the real exchange rate to rise and NX to fall.
ε ε1 ε2 NX(ε) NX NX2 NX1 2. Fiscal policy abroad An increase in r* reduces investment, increasing net capital outflows and the supply of dollars in the foreign exchange market… …causing the real exchange rate to fall and NX to rise.
ε ε2 ε1 NX(ε) NX NX1 NX2 3. An increase in investment demand An increase in investment reduces net capital outflows and the supply of dollars in the foreign exchange market… …causing the real exchange rate to rise and NX to fall.
ε ε2 ε1 NX(ε)2 NX(ε)1 NX NX1 4. Trade policy to restrict imports At any given value of ε, an import quota IM NX demand for dollars shifts right Trade policy doesn’t affect S or I , so capital flows and the supply of dollars remains fixed.
ε ε2 ε1 NX(ε)2 NX(ε)1 NX NX1 4. Trade policy to restrict imports Results: ε > 0 (demand increase) NX = 0(supply fixed) IM < 0 (policy) EX < 0(rise in ε )
Inflation and nominal exchange rates Percentage 10 change 9 in nominal 8 exchange South Africa rate 7 6 Depreciation relative to Italy 5 U.S. dollar 4 New Zealand Australia Spain 3 Sweden Ireland 2 Canada 1 UK France Belgium 0 - 1 Appreciation Germany Netherlands relative to - 2 U.S. dollar Switzerland - 3 Japan - 4 - 3 - 2 - 1 0 1 2 3 4 5 6 7 8 Inflation differential
1970s 1980s actual change closed economy small open economy G – T 2.2 3.9 S 19.6 17.4 r 1.1 6.3 no change I 19.9 19.4 no change NX -0.3 -2.0 no change ε 115.1 129.4 no change CASE STUDY The Reagan Deficits revisited Data: decade averages; all except r and ε are expressed as a percent of GDP; ε is a trade-weighted index.