Download
1 / 15
150 likes | 269 Views
Benthic Community Assessment Tool Development. Sediment Quality Objectives for California Bays and Estuaries. Ananda Ranasinghe (Ana) Southern California Coastal Water Research Project (SCCWRP) anar@sccwrp.org. Outline. Background: Why Benthic Communities? Approach

E N D
Benthic Community Assessment Tool Development Sediment Quality Objectives for California Bays and Estuaries Ananda Ranasinghe (Ana) Southern California Coastal Water Research Project (SCCWRP) anar@sccwrp.org
Outline • Background: Why Benthic Communities? • Approach • Refine and Validate Benthic Indicators • Evaluate Field and Laboratory Methods • Task Details and Schedule
Why Benthos? • Benthos are living resources • Direct measure of what legislation intends to protect • Benthic organisms are good indicators of conditions at a site because of • Limited mobility, high exposure to anthropogenic impacts, integrate different types of impacts, and over time • Already being used to make Regulatory and Sediment Management decisions • Santa Monica Bay removed from 303(d) list • Was listed for metals in early 1990’s • 301(h) waivers granted to dischargers • Toxic hotspot cleanup decisions in San Diego Bay
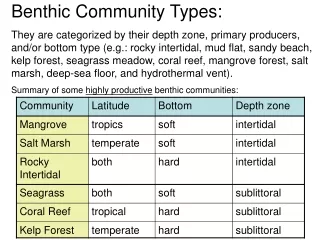
Benthic Assessments Pose Several Challenges • Interpreting species abundances is difficult • Samples may have tens of species and hundreds of organisms • Benthic species and abundances vary naturally with habitat • Comparisons to determine altered states should vary accordingly • Sampling methods vary • Gear, sampling area and sieve size affect species and individuals captured
Benthic Indices Meet These Challenges Benthic Indices • Are Single values • Account for habitat differences • Remove much of the subjectivity associated with data interpretation • Provide simple means of • Communicating complex information to managers • Tracking trends over time • Correlating benthic responses with stressor data • Are included in the U.S. EPA’s guidance for biocriteria development
California Benthic Indices • Three benthic indices have been developed for California bays • BRI (Benthic Response Index) for Southern California • Smith et al. (2001, 2003) • IBI (Index of Biotic Integrity) for San Francisco Bay • Thompson and Lowe (In press) • RBI (Relative Benthic Index) for several bays • Hunt et al. 2001 • They can all benefit by refinement • Data limitations constrained development • How assessment results relate is not known • Except for some preliminary work completed recently
Refine And ValidateBenthic Indicators(3 Tasks) • Task 1: Refine existing benthic indices • Task 2: Compare and evaluate benthic tools • Task 3: Identify natural assemblages and the habitat factors that structure them
Task 1: Refine Benthic Tools • Initial development of the three indices was constrained by data limitations • Lack of independent data for validation • Insufficient data from highly disturbed sites to define the entire range of the impact gradient • Uncertainty in the effect of environmental variables regardless of pollution impacts • Subsequent data collection has removed this constraint for two regions • Southern California bays & San Francisco Bay • Refine all three indices for the two regions • Same approaches as before, but more data
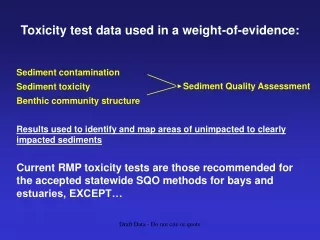
Task 2: Evaluate Benthic Tools • For the three indices, it is not known • How assessment results relate • How robust they are to • Taxonomy (level and accuracy) • Seasonality, Grain size distribution, TOC and other habitat factors • Evaluate based on: • Agreement with sediment chemistry and sediment toxicity • Conformity with known spatial and temporal gradients • Repeatability • Agreement with each other
Task 3: Identify Natural Assemblages (Biogeography) • Identify naturally occurring assemblages and the habitat factors that structure them • To define habitats for determination of altered states • Evaluate annual and seasonal stability of habitat definitions • Approach • Eliminate potentially contaminated sites from data collected throughout California using consistent methods • Use cluster analysis to identify assemblages and test habitat variables across dendrogram splits • Follows Bergen et al. (2001) • Leverages the EMAP West Coast benthic index effort • Potentially increase data availability for index development in northern CA bays • Preliminary analysis indicates OR & WA coastal bays are similar to northern CA bays
Support Methods Guidance(2 Tasks) • Task 4: Evaluate field sampling methods • Three gear sizes and two sieve mesh sizes are used in California • What is the nature and magnitude of these effects on assessment results? • Task 5: Develop sample processing QA procedures • Assessment results vary depending on • Sorting efficiency, and • Identification and counting accuracy • Develop procedures to ensure consistent assessments regardless of which laboratory processes samples
Task 4: Evaluate Field MethodsWhy? • Sampling gear affects benthic assessments • Larger gear collect more species and organisms • Smaller sieves catch • More and smaller species • More organisms that can’t be identified to species • Three gears and two sieves are used in California • Gears: • 0.1m2 Van Veen grab • 0.05 m2 Van Veen grab • 0.00785 m2 corer • Sieves: • 1.0 mm or 0.5 mm apertures
Task 4: Evaluate Field MethodsApproach & Data • Approach: Evaluate assessment differences • For samples processed with different gear and sieves • Apply indices and measures from Tasks 1 & 2 • Identify the nature and magnitude of gear and sieve effects • Data • For gear questions: 89 sites sampled in summer 2004 • For sieve questions: • 89 sites sampled in summer 2004 • 64 EMAP 1999 sites (Process 0.5 mm fractions) • 103+ sites have existing data for San Francisco Bay and Marina Del Rey
Task 5: Develop QA Procedures • Sample processing and taxonomy affect assessment results • Recovery of organisms from samples • Accuracy of taxonomy and enumeration • QA approach will build on successful models • EMAP, SCBPP, Bight’98, Bight’03 and SCAMIT • Procedures will address three areas • Sorting (organism recovery) • Accuracy of counts • Accuracy of identifications