Download
1 / 27
270 likes | 424 Views
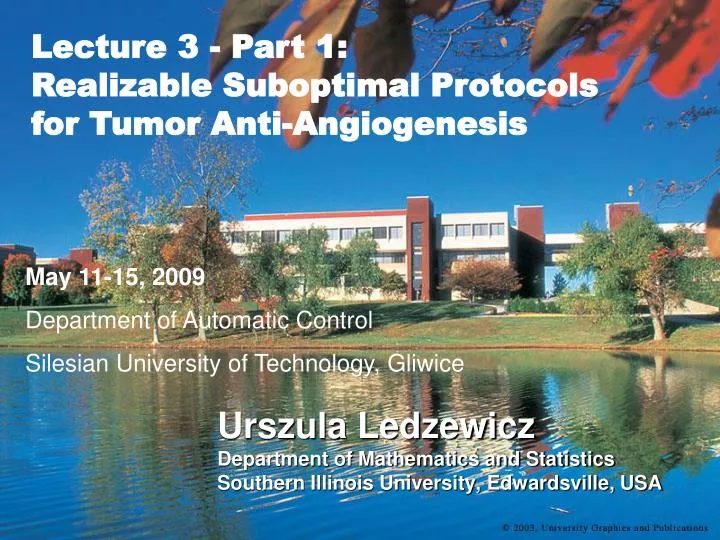
3. Lecture 3 - Part 1: Realizable Suboptimal Protocols for Tumor Anti-Angiogenesis. Urszula Ledzewicz Department of Mathematics and Statistics Southern Illinois University, Edwardsville, USA. May 11-15, 2009 Department of Automatic Control Silesian University of Technology, Gliwice.

E N D
3 Lecture 3 - Part 1: Realizable Suboptimal Protocols for Tumor Anti-Angiogenesis Urszula Ledzewicz Department of Mathematics and Statistics Southern Illinois University, Edwardsville, USA May 11-15, 2009 Department of Automatic Control Silesian University of Technology, Gliwice
Collaborators Heinz Schättler Dept. of Electrical and Systems Engineering Washington University, St. Louis, Missouri, USA Helmut Maurer Rheinisch Westfälische Wilhelms-Universität Münster, Münster, Germany John Marriott Dept. of Mathematics and Statistics, Southern Illinois University, Edwardsville, USA
Research Support Research supported by NSF grants DMS 0205093, DMS 0305965 and collaborative research grants DMS 0405827/0405848 DMS 0707404/0707410
References • U. Ledzewicz and H. Schättler, Optimal and Suboptimal Protocols for Tumor Anti-Angiogenesis, J. of Theoretical Biology, 252, (2008), pp. 295-312, • U. Ledzewicz, J. Marriott, H. Maurer and H. Schättler, The scheduling of angiogenic inhibitors minimizing tumor volume, J. of Medical Informatics and Technologies, 12, (2008), pp. 23-28 • U. Ledzewicz, J. Marriott, H. Maurer and H. Schättler, Realizable protocols for optimal administration of drugs in mathematical models for anti-angiogenic treatment, Math. Med. And Biology, (2009), to appear
begin of therapy an optimal trajectory end of “therapy” final point – minimum of p Synthesis of Optimal Controls for [Hahnfeldt et al.] u=a u=0 p q Full synthesis 0asa0 typicalsynthesis - as0
singular arc full dose partial dose - singular no dose An Optimal Controlled Trajectory for [Hahnfeldt et al.] Initial condition: p0 = 12,000 q0 = 15,000 Optimal terminal value: 8533.4 time: 6.7221 Terminal value for a0-trajectory: 8707.4 time: 5.1934
Suboptimal Protocolsfor [Hahnfeldt et al.] • full dose protocol: give over time • half dose protocol: • give over time • averaged optimal dose protocol: • give over time where is the time • when inhibitors are exhausted along the optimal • solution and e.g., for p0=12,000 and q0=15,000
Minimum tumor volumes pmin u • full dose • averaged optimal dose • optimal control q0 q0 Values of the minimum tumor volume for a fixed initial tumor volume as functions of the initial endothelial support averaged optimal dose
Minimum tumor volumes pmin u half dose full dose averaged optimal dose optimal control q0 q0 Values of the minimum tumor volume for a fixed initial tumor volume as functions of the initial endothelial support averaged optimal dose
Minimum tumor volumes pmin u full dose half dose averaged optimal dose optimal control q0 q0 Values of the minimum tumor volume for a fixed initial tumor volume as functions of the initial endothelial support averaged optimal dose
Comparison of Trajectories 0 full dose half dose optimal control singular arc averaged optimal dose 0
Minimal Tumor Size dosages from u=10 to u=100 blow-up of the value for dosages from u=46 to u=47
singular arc full dose partial dose - singular no dose An Optimal Controlled Trajectory Initial condition: p0 = 12,000 q0 = 15,000 Optimal terminal value: 8533.4 time: 6.7221 Terminal value for a0-trajectory: 8707.4 time: 5.1934
[Ergun, Camphausen and Wein],Bull. Math. Biol., 2003 For a free terminal time minimize over all measurable functions that satisfy subject to the dynamics
Synthesis for Model by [Ergun et al.] Full synthesis 0asa0, typicalsynthesis - as0
Example of optimal control and corresponding trajectory for Model by Ergun et al. Initial condition: p0 = 8,000 q0 = 10,000
Valueof tumorfor one dose protocols dosages from u=0 to u=15 blow-up of the value for dosages from u=8 to u=12 minimum at u=10.37, p(T)=2328.1
Conclusions • The optimal control which has a singular piece is not medically • realizable (feedback), but it provides benchmark values and can • become the basis for the design of suboptimal, but realistic protocols. • The averaged optimal dose protocol gives an excellent sub-optimal • protocol, generally within 1% of the optimal value. The averaged • optimal dose decreases with increasing initial tumor volume and is • very robust with respect to the endothelial support for fixed initial • tumor volume • Optimal piecewise constant protocols can be constructed that • essentially reproduce the performance of the optimal controls