Download
1 / 9
90 likes | 246 Views
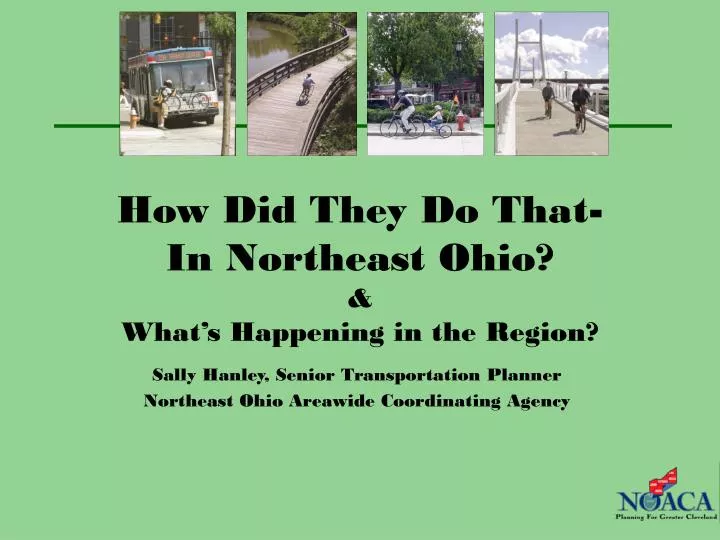
How Did They Do That- In Northeast Ohio? & What’s Happening in the Region?. Sally Hanley, Senior Transportation Planner Northeast Ohio Areawide Coordinating Agency. Do What?. Large increase in bikeways Change attitudes (public officials, engineers, the public)

E N D
How Did They Do That-In Northeast Ohio?&What’s Happening in the Region? Sally Hanley, Senior Transportation Planner Northeast Ohio Areawide Coordinating Agency
Do What? • Large increase in bikeways • Change attitudes (public officials, engineers, the public) • Create environment in which bike transportation has become a serious issue • Raise awareness of bicycling as an important urban amenity
NOACA: Metropolitan Planning Organization for Cleveland Area Transportation & Environmental Planning 5 Counties: Cuyahoga, Geauga, Lake, Lorain, and Medina Board composed of elected officials from all 5 counties-- make decisions on spending federal transportation funds
NOACA Goal: Establish a more balanced transportation system … by prioritizing … transit, pedestrian, and bicycle travel instead of only single occupancy vehicle movement. • Regional Bicycle Transportation Plans: 1997, 2008 • Project reviews & recommendations for bike/ped accommodation • Conducted “Bike Friendly Community” Campaign • Created Bike Transportation Maps • Conduct Training Courses for Planners & Engineers • Bicycle Counts • Adopted Multimodal Planning Policies • Priority System
Bikeway Inventory in 1997: 103 miles of paths 6 miles of lanes Total of 109 miles of bikeways