Download
1 / 11
110 likes | 374 Views
Geant4 Visualization. DAWN. OpenGL. VRML. Visualization. Seeing what one does usually helps One can visualize geometry, hits, trajectories One can assign color, transparency to volumes, tracks, hits displays Important for analysis and debugging. Visualization.

E N D
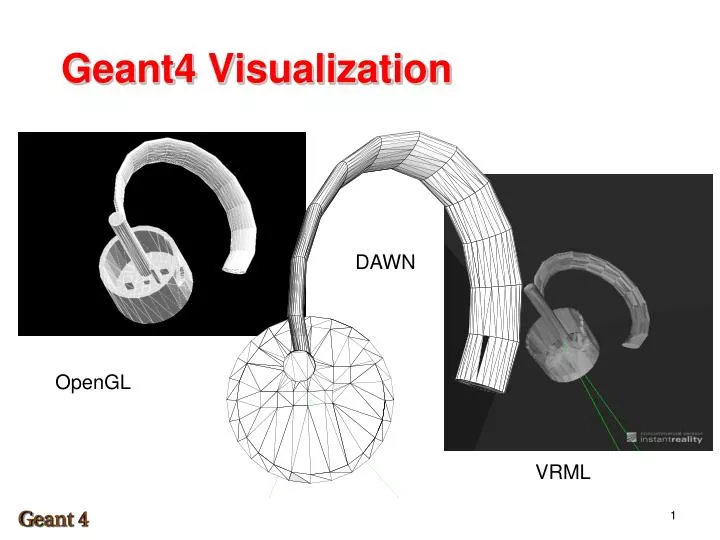
Geant4 Visualization DAWN OpenGL VRML
Visualization • Seeing what one does usually helps • One can visualize geometry, hits, trajectories • One can assign color, transparency to volumes, tracks, hits displays • Important for analysis and debugging
Visualization • Additionally, users may wish to add markers, text or lines to highlight/mark specific detector components or tracks • To visually distinguish detector components and tracks it is helpful to give them • Different colors • Transparency • Force wire-frame style display • This is done by setting visualization attributes using G4VisAttributes
Controlling Visualization from Code • Setting the visualization attributes for a given logical volume G4VisAttributes* visAtt = new G4VisAttributes(); //set visibility (display or not) visAtt->SetVisibility(true) //now you see me visAtt->SetVisibility(false) //now you don’t //set color G4Color red(r = 1.0, g = 0., b = 0.); //in RGB-color space; visAtt->SetColor(red); //set attributes for logical volume redCubeLog->SetVisAttributes(visAtt); //vis attributes can be reused redCubeLog2->SetVisAttributes(visAtt); Consider if every component reallyneeds a different color– usually the shapeand position is already quite helpful
Controlling Visualization from Code • Adding a polyline (e.g. for axis, tracks) , marker (e.g. for hits) or text to a 3D scene G4PolyLine xAxis; xAxis.append(G4Point3d(0., 0., 0.,)); //polylines are defined by segments between points xAxis.append(G4Point3d(5.0*m, 0., 0.)); G4Color blue(0., 0., 1.); G4VisAttributes visAtt(blue); xAxis.SetVisAttributes(visAtt); /vis/scene/add/axiswill draw axis at a givenposition for you!This is just as an example G4Point3d position(5.0*m, 0., 0.); G4Circle mark(position); //G4Circle, G4Square, G4Text Mark.SetScreenDiameter(1.0); Mark.SetVisAttributes(visAtt);
Interactive Visualization using OpenGL • Useful for debugging, quick checks but also analysis because the detector can easily be viewed “from all sides” • Directly interact with the simulation • Easiest to use with Qt-based UI interface //in application main #ifdef G4VIS_USE G4VisManager* visMan = new G4VisExecutive(); visMan->initialize(); #endif … #ifdef G4VIS_USE delete visMan; // don’t forget to delete the vis manager #endif
Interactive Visualization using OpenGL • In UI: Idle> /vis/open OGLIQt #open Qt OGL viewer Idle> /vis/drawVolume #draw the detector volume Idle> /vis/viewer/set/style wireframe Idle> /vis/viewer/viewpointThetaPhi 20 70 Using the mouse is usually more intuitive for selecting viewpoint. Also try right-clicking into the viewer to get menu access to quite a few visualization options
Publication-quality Visualization using DAWN • First install the DAWN viewer from http://geant4.kek.jp/~tanaka/DAWN/About_DAWN.html Idle> /vis/open DAWNFILE #open dawn file Idle> /vis/drawVolume #draw the detector volume Idle> /vis/viewer/flush #create a .prim file for DAWN to read You can then open the .prim file in the DAWN viewer, set visualization style, camera positions etc. The output will be a high quality .eps file
Adding trajectories and hits • Up to now you have visualized your detector. Now its time to visualize some physics Idle> /vis/scene/add/trajectories Idle> /vis/scene/add/hits Idle> /run/beamOn 1 Geant4 provides a rich set of commands to customize track visualization, e.g. drawing particle tracks in different colors depending on charge, id, type etc..
Overview of visualization drivers • Multiple visualization drivers are available in Geant4 (some require external libraries) • OpenGL, as X11, Motif and Qt flavors (latter two support mouse interaction) • RayTracer • DAWN file, can be opened in DAWN viewer • VRML • OpenInventor • HepRep • PostScript
Geant4 Visualization • For interactive visualization OpenGL is usually best-suited, also allows for display tracks, hits etc. • DAWN and HepRep are well suited for event display and high quality plotting • Raytracer can produce high quality renderings with transparency, but does not support the display of particle tracks • Interactive OpenGL visualization is a helpful tool for inspecting geometries: are volumes misplaced, were transformation chosen correctly • Visualization can be used to detect overlaps