Download
1 / 28
280 likes | 447 Views
Demystifying SEIFA. Jeff Wright Peter Radisich. S ocio- E conomic I ndexes F or A reas. S ocio E conomic I ndexes F or A reas. Concept of Interest: Relative Advantage and Disadvantage. Concept of Interest: Relative Advantage and Disadvantage.

E N D
Demystifying SEIFA Jeff Wright Peter Radisich Socio-Economic Indexes For Areas
Socio Economic Indexes For Areas
Concept of Interest: Relative Advantage and Disadvantage
Concept of Interest: Relative Advantage and Disadvantage Broadly define in terms of people’s access to material & social resources, and ability to participate in society
No post-school qualifications High Income Unemployed Low Income Employed as Professional Concept of Interest: Relative Advantage and Disadvantage Needs assistance with core activities Access to Broadband One parent families Number of bedrooms
No post-school qualifications High Income Low Income Unemployed Employed as Professional Concept of Interest: Relative Advantage and Disadvantage Needs assistance with core activities Access to Broadband One parent families High number of bedrooms
No post-school qualifications High Income Unemployed Low Income Employed as Professional Concept of Interest: Relative Advantage and Disadvantage Needs assistance with core activities INDEX SCORE Access to Broadband One parent families High number of bedrooms
Socio-Economic Indexes For Areas The four indexes Index of Relative Socio-Economic Disadvantage Index of Relative Socio-Economic Advantage & Disadvantage Index of Economic Resources Index of Education & Occupation
Socio-Economic Indexes For Areas • The indexes apply at an area level • Summary of all people living in the area • Note: Socio-economic status of people within an area will vary. Base (smallest) area used: In the past Census Collection Districts (CD) (average population size = approximately 500) SEIFA 2011 Statistical Area Level 1 (SA1) (population size = approximately 300 to 400) SEIFA is also released for larger areas
Targeting areas for business & services Strategic Planning Applications of SEIFA Plus tips on good use Design of sample surveys Social & Economic Research
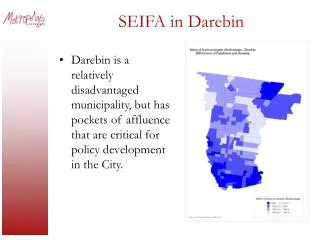
Index of Relative Advantage & Disadvantage: Quintiles by Statistical Local Area, Melbourne, 2006
Index of Relative Socio-Economic Advantage & Disadvantage: Top and bottom deciles, CD Level, Melbourne, 2006 Legend Top Decile (Most Advantaged) Bottom Decile (Most Disadvantaged) Excluded CDs (No Index Score)
Using SEIFA for Social Research A further example: Proportion of people reporting fair/poor health, by Index of Economic Resources decile (2006) Source of Health Data: ABS National Health Survey, 2004-05
Say you were standing with one foot in the oven and one foot in an ice bucket. According to the percentage people, you should be perfectly comfortable. Bobby Bragan, 1963
An example from Australia: Index of Relative Socio-Economic Disadvantage: Deciles, CD Level, Campbelltown North, 2006
Good Use of SEIFA - Summary Good Use of SEIFA - Key Points • SEIFA is for area level analysis • Interpretation if using for individuals, represents the surrounding area, not the individual! • Interpretation (health analysis) • A greater proportion of people living in the most disadvantaged 10% of CDs report fair/poor health • Ecological fallacy • A greater proportion of the 10% most disadvantaged people report fair/poor health • Why? A person who reports fair/poor health may live in a disadvantaged area, but not be disadvantaged themselves
Accessing SEIFA Free of charge on the ABS website
Take home messages • Summary measures with many applications • Free of charge • SEIFA 2011 will be released early 2013
Additional Slides For discussion purposes & answering questions
SEIFA 2011 – Geography SA1 will be the base level ABS Structures – ASGS SA1 : score SA2 : score + distribution SA3 : score + distribution SA4 : distribution State : distribution Non-ABS Structures (constructed using 'best fit' correspondences) SLA : score + distribution LGA : score + distribution SSC : score + distribution POA : score + distribution CED : distribution (not SED) Example of Distribution Measure:
Index of Disadvantage • low income • low education • low occupation • housing • disability • Indigenous status • poor English • good for focusing on disadvantaged areas • Index of Advantage & Disadvantage • high/low income • high/low education • high/low occupation • housing • broadband internet • disability • good for identifying advantaged OR disadvantaged areas
Index of Economic Resources • income • housing size/cost • tenure type • business owners • good for focusing on financial aspects of advantage/disadvantage • Index of Education • & Occupation • education • occupation • employment • good for focusing on education/occupation
Using SEIFA for Social Research Example: Investigating the relationship between socio-economic status & age Proportion of total population (all ages) Decile of IRSAD IRSAD = Index of Relative Socio-Economic Advantage & Disadvantage (2006)
Using SEIFA for Social Research Proportion of adults with ‘high’ or ‘very high’ mental distress, by Index of Relative Advantage and Disadvantage decile Source of Health Data: ABS National Health Survey, 2004-05
Postal Area: 2617 State Suburb 25,476 people 3,057people Census Collection District Statistical Local Area 3,057people 649 people