Download
1 / 15
160 likes | 290 Views
Visualizing Dynamic Memory Allocations. Sergio Moreta and Alexandru Telea Department of Mathematics and Computer Science Technische Universiteit Eindhoven, the Netherlands s.moreta@student.tue.nl, alext@win.tue.nl By: Rizal Mohd Nor rnor@cs.kent.edu.

E N D
Visualizing Dynamic Memory Allocations Sergio Moreta and Alexandru Telea Department of Mathematics and Computer Science Technische Universiteit Eindhoven, the Netherlands s.moreta@student.tue.nl, alext@win.tue.nl By: Rizal Mohd Nor rnor@cs.kent.edu
Dr. Alexandru C. Telea Sergio Moreta • Department of Mathematics and Computing Science, Eindhoven University of Technology The Netherlands • Research Area: • scientific visualisation • information visualisation • multiscale visualisation • interactive systems design • computer imaging • object-oriented and component-oriented software design • compiler/interpreter design • fact extraction • reverse engineering Department of Mathematics and Computing Science, Eindhoven University of Technology The Netherlands Graduate Student
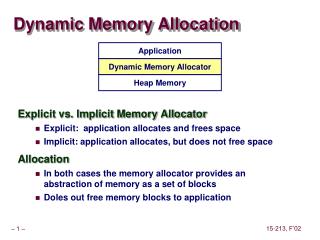
Motivation • To present a visualization tool for dynamic memory allocation, information obtained from instrumenting the runtime allocator used by C programs. • The goal is to convey insight in the dynamic behavior of the allocator. • The purpose is to help the allocator designers understand the performance and workings of the allocator.
Introduction • Dynamic memory allocators is a component of the runtime that is responsible for providing memory blocks, as offered by the malloc C function and new C++ operator. • Allocated blocks are returned to the runtime, via explicit calls to free (C) or delete (C++) or via garbage collection (java) • Several performance metrics are relevant: • The allocator should minimize memory fragmentation • the allocator should minimize waste • the allocator should provide a good response time for both allocation and free requests for a wide mix of scenarios
Problem • Understanding log data to detect sub-optimal performance, and when and why this occurs, is difficult. • Typical logs can easily contain hundreds of thousands of high frequency events. • Examples are finding incorrect allocation/deallocation sequences which could lead to memory leaks, dangling pointers, or uninitialized memory reads.
Core Visualization Design(0) • Design is driven by several goals: scalability, limited cluttering, insight into fine-scale behavior, intuitiveness, and ease of use. • Use 2D instead of 3D. Justification in thesis paper not to use 3D: • Object occlusion. • Awkward navigation. • Awkward selection. • Obscured relations. • Slow rendering. • Using Adapted Rainbow Color Map. Unfortunately, normal humans can only distinguish 6-10 colors.
Interactive tool for visualizing dynamic memory allocation. The Occupancy bar shows, using a blue (low) to red (high) color map, the evolution in time of the total memory allocated in the bin shown in the main view.
Showing Block Structure color blocks using flat shading, same-color neighbor blocks cannot be distinguished Drawing line borders works only for zoomed-in views, where the block sizes are larger than several pixels. Solve problem by overlaying each block using a so-called shaded cushion. Core Visualization Design(1)
Showing Subpixel structure Many (de)allocation events can occur at very high frequencies The size of an event rectangle can easily become smaller than one pixel. Simply drawing the rectangles produces wrong effects, as a pixel will show a single rectangle, or even none, depending on round-off errors. Solution, anti-aliasing, α changes visibility, and Base changes pixel fractions Core Visualization Design(2)
Visualizing Activity in the Occupancy Bar The occupancy bar has the same problem as the main view due to high-frequency events. An improvement is to draw black bars outlining no-activity zones which are larger than a few pixels Also add cushioning and anti-aliasing Core Visualization Design(3)
Hierarchical Agglomerative Clustering provide a multi-level partitioning of data. Dynamic partitioning of data serves as a visual aid for supporting the user in detecting the artifact’s high-level structure. Core Visualization Design(4)
Correlation of Multiple Views An important task is to compare different bins to detect possible unbalances, which can be further corrected by adjusting the allocator parameters Just displaying bin views in a grid layout does not allow users to easily see if certain values of interest are indeed correlated. Solution, use cushion cursors Core Visualization Design(5)
Application • By comparing Bins and heap occupancy visualization, it is possible to see certain patterns. • Particularly, questions such as the ones below can be answered. • Are allocations always done from low to high addresses? • Is activity correlated with the memory allocating functions?
My thoughts • How does this help program comprehension? • Not much. • Alternative ways for visualizing abundance of data that are time sensitive. • Understanding memory usage for limited memory devices like embedded systems. • What else can we use it for? • Maybe to understand patterns in high frequency changes between fixations for eye tracking system. • Clustering method used a certain distance metric to cluster objects, this idea can be applied in fish view to reduce or amplify context view.