Download
1 / 54
540 likes | 656 Views
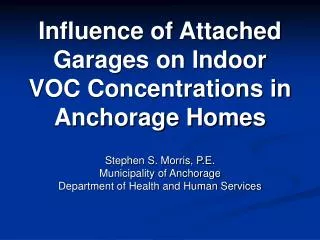
Influence of Attached Garages on Indoor VOC Concentrations in Anchorage Homes. Stephen S. Morris, P.E. Municipality of Anchorage Department of Health and Human Services. Acknowledgements. Anne Schlapia, Matt Stichick and Larry Taylor – MOA DHHS John Freeman, Phil Kaluza, Ginny Moore – ABSN

E N D
Influence of Attached Garages on Indoor VOC Concentrations in Anchorage Homes Stephen S. Morris, P.E. Municipality of Anchorage Department of Health and Human Services
Acknowledgements Anne Schlapia, Matt Stichick and Larry Taylor – MOA DHHS John Freeman, Phil Kaluza, Ginny Moore – ABSN Sally Liu, Tim Gould, Dave Hardie and Timothy Ting University of Washington
A previous Anchorage study sparked interest in a further investigation of the influence of attached garages on air quality inside Anchorage homes.
Architectural, Behavioral, and Environmental Factors Associated with Indoor VOCs in Anchorage Homes (1995) • Sampled 137 homes for BETX between December 1994 and February 1996 • Summa canisters deployed in living space of homes for 24 hours • Documented architectural, behavioral and environmental characteristics of each home sampled
The most important factor influencing [benzene] and other BTEX compounds was the presence of an attached garage. • Cigarette smoking was not an important factor in determining benzene concentration in living space of the home. • The presence of an attached garage was the single most important variable associated with elevated benzene inside the home.
Comparison of Mean Benzene Concentrations in Single Family Homes 1994-1996 Anchorage Study 20.0 18.0 18.0 16.0 14.0 12.0 [benzene] ppb 10.0 8.0 6.8 6.0 3.2 4.0 2.0 0.0 garage garage no attached with parked cars w/o parked cars garage N = 46 N = 16 N = 14
Data suggested that attached garages increase in-home exposure to benzene five-fold. Incremental increase in lifetime exposure cancer risk was approximately 1 in 6,000.
Benzene content (3.9%) and volatility of Alaska gasoline is higher than most of the U.S.
We wanted to explore the mechanisms responsible for elevated benzene in homes with attached garages.
Study Objectives • Measure VOC concentrations in a representative sample of 50 Anchorage homes with attached garages to assess personal exposures. • Measure garage to house air infiltration rates. Determine architectural / mechanical factors affecting the amount of air entering house from the garage. • Identify possible strategies for reducing in-home VOC exposures through modification of architectural features, mechanical systems and/or modification of personal behaviors.
How much garage air infiltrates into the home and what are the responsible mechanisms? • How high are benzene and other VOCs inside the garage and what sources are responsible?
We narrowed study scope to include non-smoking, detached single familyhomes with attached garages only. • Simplified analysis of air exchange rates. • Eliminated other possible confounding variables. • Confined sampling to winter season when previous study showed VOC concentrations were highest.
A representative sample of Anchorage homes was selected for sampling. • Used Anchorage municipal property tax database to characterize housing stock by age and square footage. • Selected proportional number of houses in each sampling bin.
Age and size distribution of detached single family homes with attached garages in Anchorage. Resultant sampling profile (50 home target)
Tracer gases were used to estimate air exchange rates between garage and house.
A PMCH tracer gas source emitter was deployed in each house and a PDCH source in each garage. The emission rate of each source was known. PMCH PDCH house garage
Capillary absorption tubes (CATs) were deployed in the house and garage to measure concentrations of PMCH and PDCH over a 24-hour period. PMCH C A T PDCH C A T
Mass balance approach was used to compute air exchange rates between garage and house, house and outside, and garage and outside.
QLG QLA PMCH QGA QGL PDCH Four simultaneous equations were developed to estimate 4 unknown flows from measured [PMCH] and [PDCH] and the known emission rates of the two tracer gases. Simultaneous equations could be solved and flow rates QGL, QGA, QLG, and QLA could be computed for each house.
The proportion of air in the house coming from the garage could be easily derived. Proportion of house air coming from garage = QGL/(QGL + QAL) QAL PMCH QGL PDCH
ATD tubes were used to collect VOC samples in the house and garage. • Samplers were deployed in active living space in home, typically in living room.
Relationship Between Outdoor [CO] and [benzene] 7.0 6.0 5.0 4.0 ppb Outdoor [benzene] y = 1.7858x + 1.6288 2 3.0 R = 0.5882 2.0 1.0 0.0 0.0 0.5 1.0 1.5 2.0 2.5 3.0 Outdoor [CO] ppm Ambient CO measurements were used to estimate outdoor concentrations of BTEX and butadiene.
Summary of In-house VOC Concentrations N mean median max 1,3-butadiene 46 0.73 0.44 6.26 benzene 45 7.60 5.16 35.49 carbon tetrachloride 46 0.08 0.09 0.13 chlorobenzene 46 0.14 0.09 0.62 ethylbenzene 46 2.51 1.65 9.34 methylene chloride 46 2.79 0.35 73.16 napthalene 46 0.14 0.08 1.20 o-xylene 46 2.98 2.15 11.21 toluene 46 18.89 12.91 81.73 trichloroethene 44 0.03 0.02 0.49 m,p-xylene 46 6.92 5.19 33.78
Distribution of Benzene Concentrations Inside Homes with Attached Garages 25 22 20 15 12 Number of Homes 10 6 5 2 2 1 0 0 0 to 5 to 10 to 15 to 20 to 25 to >30 ppb 5 ppb 10 ppb 15 ppb 20 ppb 25 ppb 30 ppb
For benzene and other BTEX compounds, mean concentrations in the house were approximately 5 times higher than outside.Garage concentrations were 10 to 15 times higher than outside.
Mean Benzene 30.00 26.08 25.00 20.00 ppb 15.00 10.00 7.60 5.00 1.66 0.00 House Garage Outdoor
Ethylbenzene 7.00 6.51 6.00 5.00 4.00 3.00 2.51 2.00 1.00 0.46 0.00 House Garage Outdoor Toluene 70.00 61.35 60.00 50.00 40.00 30.00 18.89 20.00 10.00 5.42 0.00 House Garage Outdoor o-Xylene m,p- Xylene 9.00 25.00 8.50 21.82 8.00 20.00 7.00 6.00 15.00 5.00 4.00 10.00 2.98 3.00 6.92 2.00 5.00 0.72 1.00 1.44 0.00 0.00 House Garage Outdoor House Garage Outdoor
Garage to house infiltration rates varied considerably among homes sampled.Homes with forced air furnaces in the garage had higher infiltration rates than homes with other heating configurations.
Comparison of Median Infiltration Rates Proportion of House Air Originating from Garage 45% 40% 36.7% 35% 30% 25% 18.4% 20% 17.0% 15% 10% 5% 0% Forced Air Forced Air Hydronic Furnace Furnace N=11 in Garage in House N = 15 N = 5
Although the [CO] in many garages was high immediately after vehicle start-ups, exhaust emissions do not appear to be the primary source of VOCs in the garage.
House 30 50 House 40 Garage 30 Outside [CO] ppm 20 10 0 0 1 2 3 4 5 6 7 8 9 11 12 13 14 15 16 17 18 19 20 21 22 23 Hour of Day
CO vs benzene in garage 120 100 80 benzene (ppb) 60 2 R = 0.2729 40 20 0 0.00 2.00 4.00 6.00 8.00 10.00 12.00 14.00 16.00 18.00 CO (ppm)
There was a stronger relationship between CO and butadiene concentrations.
CO vs butadiene in garage 8 7 6 5 2 R = 0.4111 butadiene (ppb) 4 3 2 1 0 0.00 2.00 4.00 6.00 8.00 10.00 12.00 14.00 16.00 18.00 CO (ppm)
The data do not show a significant association between the benzene level in the garage and: • The number of vehicles parked in the garage; • The age of the vehicles in the garage; or • The number of trips originating from the garage.
Evaporative emissions may be a more important source than exhaust emissions.
Comparison of Benzene Concentration in the Garage 35.0 32.3 30.0 25.0 20.0 median [benzene] ppb 15.0 10.0 7.6 5.0 0.0 Garage Used Garage Not Used for Gasoline for Gasoline Equipment Storage Equipment Storage N = 23 N = 8
Having an elevated level of benzene in the garage was a good indicator that benzene levels in the house would also be high.
Garage Benzene vs. House Benzene 40 35 30 25 measured benzene in house (ppb) 20 y = 0.2789x + 0.4748 2 R = 0.7291 15 10 5 0 0 20 40 60 80 100 120 measured benzene in garage
The benzene concentration in the house could be precisely predicted from the garage concentration if the air exchange rate between the garage and house was known.
[benzeneA] QAL ? PMCH [benzeneL] [benzeneG] QGL PDCH [benzeneL] = [benzeneA] x QAL/(QGL + QAL) + [benzeneG] x QGL/(QAL + QGL)
Computed vs. Measured House Benzene 40 35 30 25 y = 0.9224x +0.6102 2 R = 0.9563 computed benzene in house (ppb) 20 15 10 5 0 0 5 10 15 20 25 30 35 40 measured benzene in house