Download
1 / 9
90 likes | 238 Views
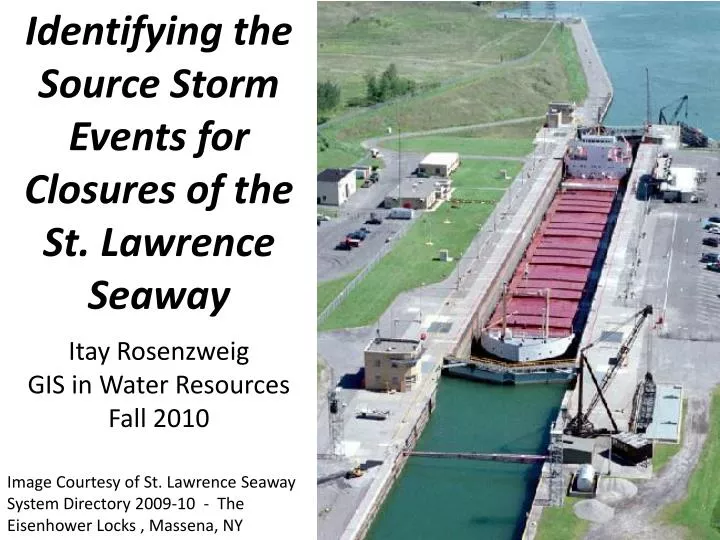
Identifying the Source Storm Events for Closures of the St. Lawrence Seaway. Itay Rosenzweig GIS in Water Resources Fall 2010. Image Courtesy of St. Lawrence Seaway System Directory 2009-10 - The Eisenhower Locks , Massena, NY. Objectives.

E N D
Identifying the Source Storm Events for Closures of the St. Lawrence Seaway ItayRosenzweig GIS in Water Resources Fall 2010 Image Courtesy of St. Lawrence Seaway System Directory 2009-10 - The Eisenhower Locks , Massena, NY
Objectives • Identify all in-season closures of the St. Lawrence Seaway since 2000 • Filter the closures caused by hydrologic conditions in the river for study • Trace river peak flows to their Source Storm Events • Identify patterns in storm events causing Seaway Closure
The St. Lawrence Seaway • Opened in 1959 • Combined tonnage shipped through: 160 million metric tonnes • 3,700 km long • 15 locks
St. Lawrence River Section 8 locks 42 km Montreal Lake Ontario Soo Locks Welland Canal Section 8 locks 42 km Lake Eire
HydroSHEDS Hydrological data and maps based on SHuttleElevation Derivatives at multiple Scales Data Available Through http://hydrosheds.cr.usgs.gov/ or from Add Data from ArcGIS Online…
The St. Lawrence River Watershed Drainage Area: 1,050,000 sq.km
North American Regional Reanalysis • Historic “Reanalysis” model of climate conditions in North America • Data from 1979 to present (through mid2009) • Precipitation, Atmospheric Pressure, Soil Conditions, Groundwater flow, Air Temp, Surface Albedo • Appx. 32km grid resolution • 3-hr temporal resolution HUGE Thanks to Glenn Rutledge and Dan Swank at NOAA
What’s Next? • Use NARR to get rainfall data in the basin for the week preceding each closure • Identify patterns in the storm events • Currently waiting on reply from St. Lawrence Seaway Development Corporation – Objective Criteria for closing the Seaway?