Download
1 / 20
200 likes | 344 Views
Introduction to Engineering Bike Lab 2 - 1. Agenda Begin Bike Lab #2. P. P. Part I - Bicycle Design Material as Structural Components. How Materials Are Loaded. TENSION / COMPRESION. M. BENDING. P. How Materials Are Loaded. TORSION. T.

E N D
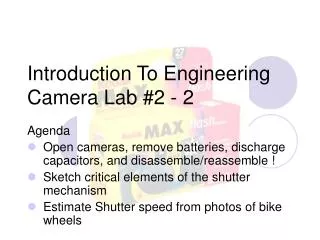
Introduction to EngineeringBike Lab 2 - 1 Agenda Begin Bike Lab #2
P P Part I - Bicycle Design Material as Structural Components How Materials Are Loaded TENSION / COMPRESION M BENDING P
How Materials Are Loaded TORSION T Most practical applications are combinations of tension/compression, bending, and torsion
P DL P L P A Characterization of Stiffness and Strength of Materials The tension test: Strain: Stress: Units of stress:
Ceramic Yield Stress + + Steel + Aluminum Yield Stress Stress s Plastic Elastic Strain e Stress-Strain Curve In the elastic (linear) portion of the stress-strain curve: (Hooke’s Law) Modulus of Elasticity (slope of s - e) curve) (Material Stiffness)
Steel Aluminum Copper Titanium Modulus of Elasticity 29x106 10.1x10⁶ 17x106 16.5x10⁶ (psi) Yield Stress 36,000 - 14,000 - 10,000- 25,000- (psi) 100,000 73,000 53,000 120,000 Stress-Strain Yield Stress is the limit of the elastic region. Materials that are loaded within the elastic region will return to their original dimensions upon unloading Typical values:
Stress-Strain Structural components are designed to deform (change dimensions) when used. For Example: The top floor of the Sears tower in Chicago can sway 6 inches due to the force applied by the wind
Stress-Strain The tips of the wings of a Boeing 747 Jumbo jet deflect up 14 feet as the aircraft takes off.
s L Part II Bending of a Cantilever Beam F Experimental setup: Dial indicator Weights d
Part IIBending of a Cantilever Beam The deflection of the beam depends on: • The load F. More deflection with larger load. • The length of the beam. The deflection of the end increases with the length. • Material stiffness. Higher stiffness produces less deflection. • The geometry of the cross section. Higher moment of inertia (defined in the next slide), results in less deflection.
Bending of a Cantilever Beam Theoretically, the deflection of the beam at the location of the dial indicator is given by Where E is the modulus of elasticity of the beam’s material, and I is the moment of inertial of the cross section.
Moment of Inertia of a Cross Section h b b2 b1 h2 h1 Box Rectangular In the lab we will set up three cantilever beams and we will compare their deflection. Two of the beams have the same cross section geometry (rectangle), but one is made of steel and the other is made of aluminum. The third beam is made up of aluminum with a smaller cross sectional area than the first two beams, but with a box cross section.
In Lab For each of the three beams (steel rectangular, aluminum rectangular, aluminum box): • Clamp the beam and position the dial indicator such that: L = 12.5 in. and s = 11.5 in. • Load (by placing 2.5 lb weights in the bucket) incrementally (5 increments) up to: Fmax = 12.5 lb.
In Lab • Record the deflection d for each load . • Measure the beam’s cross section dimensions and calculate moment of inertia I. • Record all measurements and calculations in Worksheet A.
NOTE: • The deflection measured in the lab is greater than theory predicts. This is mainly due to how the beams are clamped. The clamped end is not a true ‘fixed’ end as assumed by theory, and the beam is not perpendicular to the side of the table. ASSUMED BEAM ACTUAL BEAM
After Lab For each of the three beams (steel rectangular, aluminum rectangular, aluminum box): • Plot the theoretically expected deflection (d) versus load (F) for 0 F Fmax • Overlay the four data points (experimental measured load and deflection). • Put all curves and data points for the three beams on one plot. Remember to label the curves.
After Lab Prepare a team Lab Report using the standard format given and include the following: • Worksheet A • Graph of the results • Answer the following: • Compare the theoretical prediction with the measurements. Explain any discrepancies that exist. • Why are tubes used for the bicycle frame? • Calculations
Wall Thickness (in.) E, Modulus of Elasticity (psi) I, Moment of Inertia (in4) Width, b (in.) Height, h (in.) Steel Beam 29x106 Aluminum Beam 10.1x10⁶ Aluminum Box N.A 10.1x10⁶ N.A Bike Lab 2: Worksheet A
Steel rectangular: Aluminum rectangular: Aluminum box:
Assignment • Read Bike Lab #2 materials