Download
1 / 85
850 likes | 1.02k Views
DKRZ German Climate Computing Center. Distributed Data Handling Infrastructures in Climatology and “the Grid”. Stephan Kindermann <kindermann@dkrz.de>. Talk Context: From climatology to grid infrastructures.

E N D
DKRZGerman Climate Computing Center Distributed Data Handling Infrastructures in Climatology and “the Grid” Stephan Kindermann <kindermann@dkrz.de>
Talk Context: From climatology to grid infrastructures • Climatology: Climatology is the study of climate, scientifically defined as weather conditions averaged over a period of time and is a branch of the atmospheric sciences (Wikipedia) • We concentrate on the part of climatology dealing with complex global climate models and especially on the aspect of data handling: • Climatology Global Climate Models HPC computers(Intro part of talk) • huge amount of model data data handling infrastructure grid • (Main focus of talk)
Grid- infrastructures: From prototypes towards a sustainable infrastructure • Access to distributed heterogeneous data repositories • A national grid project: C3Grid • Prototype C3Grid/EGEE integration • An emerging worldwide infrastructure to support intercomparison and management of climate model data
Motivation: Unprecedented environmental change is indisputable – The red areas on these two images show the expansion of seasonal melting of the Greenland ice sheet from 1992 to 2002. – The Yellow line shows the temperature increased by 1ºC from 1900 to 2000 Intertrans Umzüge wrote:
(One) Question: Environmental change because of antropogenic forcings ?! Models to understand earth system needed !!
But: • The earth system is complex and with many highly coupled subsystems (and often poorly understood coupling effects) • The need for (complex) coupled General Circulation Models (GCMs) requiring tightly coupled HPC ressources "Science may be described as the art of oversimplification: the art of discerning what we may with advantage omit." [Karl Popper, “The Open Universe”, Hutchinson, London (1982)]
Complex Earth System Models: Components
Example: The COSMOS Earth System Model COSMOS: Community Earth System Model Initiative (http://cosmos.enes.org) Atmosphere GCM Dynamics ECHAM5+PhysicsAerosols HAM(M7) Ocean+Ice GCM Dynamics MPI-OM+PhysicsBiogeochem. HAMOCC/DMS Land model Hydrology HDVegetation JSBACH
Increasing Complexity, increasing computing demands
Complexity is just one dimension .. ! Disagreement about what terms mean What is a model? What is a component? What is a coupler? What is a code base?
The DKRZ: • A national facility for the climate community • (providing compute + data services)
The german climate computing centre: DKRZ • DKRZ in Europe unique as a national service • in its combination of • HPC • Data services • Applications consulting • Non profit organization (gmbH) • with 4 shareholders: MPG (6/11), • HH/UniHH: (3/11), GKSS (1/11), AWI (1/11); • investment costs BMBF (until now) • Hamburg „centre of excellence“ • for climate related studies
.. for a brand new supercomputer • 252x32 IBM System p575 Power6 • 8x 288 port Qlogic 4x DDR IB-Switch • Power6-Cluster and HPSS movers nodes • connected to the same Infiniband Switches • Storage Capacity 10 PB / year • Archive Capacity 60 PB • Transfer Rates (proposed) • 5 GB/s (peak) • 3 GB/s (sustained) • Data migration from GPFS to HPSS
Compute power for the next generation of climate model runs .. • Linpack = 115,9 TFLOPS* • 252 Nodes = 8064 Cores • 76,4% of peak 152 TFLOP • Aggregate transfer rate* • Write: 29 GB/s • Read: 32 GB/s • Single stream transfer rate • Write: 1.3 GB/s • Read: 1.2 GB/s • Metadata operations • 10 k/s – 55 k/s • * 12x p575 I/O-Servers
Fine, but … • .. Centralized HPC Centers .. • .. Centralized Data Centers .. • .. And where ist the „Grid“ perspective ?? [Ma:07]
The Climate Model Data Handling Problem Modeling Centers produce an exponentionally growing amount of data stored in distributed data centers Integration of model data and observation data
Expected growth rate for data archive @ DKRZ We are forced to limit data archiving to ~10 PB/year
Data management for the IPCC Assessment Report AR4 AR5 • Data Volume • 10s of terabytes (1012 bytes) • Downloads: ~500GB/day • Models • 25 models • Metadata • CF-1 + IPCC-specific • User Community • Thousands of users • WG1, domain knowledge • Data Volume • 1-10 petabytes (1015 bytes) • Downloads: 10s of TB/day • Models • ~35 models • Increased resolution • More experiments • Increased complexity (ex: biogeochemistry) • Metadata • CF-1 + IPCC-specific • Richer set of search criteria • Model configuration • Grid specification from CF (support for native grids) • User Community • 10s of thousands of users • Wider range of user groups will require better descriptions of data, attention to ease-of-use
Network Traffic, Climate and Physics Data, and Network Capacity (foil from ESG-CET) Ignore the units of the quantities being graphed they are normalized to 1 in 1990, just look at the long-term trends: All of the “ground truth” measures are growing significantly faster than ESnet projected capacity All Three Data Series are Normalized to “1” at Jan. 1990
Problem to access data stored at distributed data centers all over the world • Move computation to data • Infrastructural (grid) support components needed
Data volume • “humidity flux” • workflow example: • Several PB • ~3,1TB • (300-500 files) • ~10,3GB • (28 files) • ~76 MB • ~6MB • ~66KB A typical scientific workflow Distributed Climate Data Model Data Scenario data Observation Data 1 Find & Select Data description 2 Collect & Prepare Analysis Dataset E-infrastructure components needed to support 1,2,3,4: 3 Analyse Result Dataset 4 Visualize
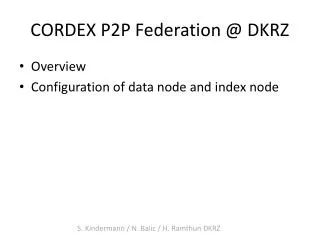
E-Science Infrastructures for Climate Data Handling • (1) A National Climate Community Grid: • The German Collaborative Climate Community • Data and Processing Grid (C3Grid) Project
C3Grid: Overview C3Grid Data Providers World Data Centers Universities Research Institutes IFM-Geomar FU Berlin Uni Köln Climate Mare RSAT DWD DKRZ PIK GKSS AWI MPI-M ISO Discovery Metadata Data Access Interface (B) (A) Collaborative Grid Workspace D-Grid (SRM, d-cache,..) C3RC Workflow Data + Data + ISO 19139 Discovery Catalog Metadata Metadata Grid Data / Job Interface C3Grid Data and Job Management Middleware Result Data Products + Metadata Portal ? !
(A) Finding data • Description at aggregate level • (e.g. experiment) • Aggregate extent description with multiple verticalExtent sections • Sub-selection in data request C3Grid metadata description based on ISO 19139
(B) Accessing Data: Server Side geographical + vertical + temporal + content + file format selection • Initial Implementation: • WSDL Web Service • next: WSRF Web Service Generic Data Request Web Service Interface Compute Resource Analysis Selection of preprocessing tools Metadata generation base data workspace pre- proc. Grid based data management metadata • Implementation Examples: • DB + Archive Wrapper (DKRZ, M&D) • Data Warehouse (Pangaea) • OGSA-DAI + DB (DWD) • .... Provider specific data access interface primary data netCDF, GRIB, HDF, XML, ..
Workflow Processing Portal • Initial set of fixed workflows integrated in portal JSDL based workflow description • Scheduler controls execution (decision based e.g. on modules info + data avalability) Workflow Scheduler RIS • „modules“ info published to Grid Resource Information Service (MDS based) Compute Resource • GT4 WS-GRAM Interfaces • Preinstalled SW packages (use of „modules“ system) workspace local resources and interfaces • Open Issues: • workflow composition support interdependency between processing and data • user defined processing debugging, substantial user support needed; security !
Portal Workflow Scheduler DIS RIS primary metadata primary data Compute Resource base data metadata workspace pre- proc. local resources and interfaces C3Grid Data / Compute Providers World Data Centers Universities Research Institutes IFM-Geomar FU Berlin Uni Köln : Interface Climate Mare RSAT DWD DKRZ PIK GKSS AWI MPI-M C3Grid Portal Distributed grid infrastructure DMS
C3Grid Security Infrastructure: • Shibboleth + GSI + VOMS / SAML attributes embedded in grid certificates … • I omit details in this talk ..
E-Science Infrastructures for Climate Data Handling • (2) Climate data handling in an international Grid infrastructure:The C3Grid / EGEE Prototype
C3Grid: community specific tools and agreements • Standardized data description • Uniform data access with preprocessing functionality • Grid based data delivery World Data Centers DKRZ AWI, GKSS, … 1 Find & Select 2 Collect & Prepare Analysis Dataset • EGEE: Approved international grid infrastructure • mature middleware • secure and consistent data management • established 7-24 support infrastructure 3 Analyse Result Dataset 4 Visualize C3Grid Middleware
SE • Publish (ISO 19115/19139) CE WN WN WN (f) Publish (ISO 19115/19139) WN WN WN OAI-PMH server Webservice Interface (b) Harvest (OAI-PMH) (g) Harvest (OAI-PMH) Bridging EGEE and C3 German Climate Data Providers: WDC Climate WDC RSAT WDC Mare DWD AWI PIK IFMGeomar MPI-Met GKSS EGEE LFC Catalog Data Resource Metadata C3Grid data interface Climate Data Workspace AMGA Metadata Catalog UI OAI-PMH server Webservice Interface Lucene Index Web Portal C3
SE (c) Stage & Provide (f) Transfer & Register (lcg-tools) (b) Retrieve (jdbc or archive) CE WN WN WN (f) Publish (ISO 19115/19139) WN (g) Register (Java-API) WN WN Webservice Interface Webservice Interface (d) notify (e) Request (webservice) (a) Request (webservice) Accessing Data EGEE LFC Catalog Data Resource Metadata C3Grid data interface Climate Data Workspace AMGA Metadata Catalog UI OAI-PMH server Webservice Interface OAI-PMH server Webservice Interface Lucene Index Web Portal C3 • Find & Select (2) Collect & Prepare
SE (c) retrieve (lcg-tools) qflux (d) Update (Java-API) CE (b) submit (glite) WN WN WN (f) Publish (ISO 19115/19139) WN WN WN Webservice Interface (e) Return graphic (a) Request (webservice) (g) Harvest (OAI-PMH) Trigger qflux workflow EGEE LFC Catalog Data Resource Metadata C3Grid data interface Climate Data Workspace AMGA Metadata Catalog UI OAI-PMH server Webservice Interface OAI-PMH server Webservice Interface Lucene Index Web Portal C3 (3) Analyse (4) Visualize
Talk Overview • The context: Climate models and HPC • A national climate research facility: The DKRZ • Climate data handling e-/grid- infrastructures • Bridging Heterogenity: Access to distributed data repositories • A national grid project: C3Grid • Prototype C3Grid/EGEE integration • An emerging infrastructure to support intercomparison and management of climate model data (in the context of CMIP5 and IPCC AR5)
Motivation (1): Different models, different results CCMa HADCM ECHAM GFDL SRES A2 Change in mean annual temperature (°C)
Motivation (2): Complexity adds uncertainty and new data intercomparison requirements ! „Carbon cycle feedbacks are likly to play a critical role in determining the atmospheric concentration of CO2 over the coming centuries (Friedlingstein et al. 2006; Denman et al. 2007; Meehl et al. 2007)” – taken from Climate-Carbon Cycle Feedbacks: The implications for Australian climate policy, Andrew Macintosh and Oliver Woldring, CCLP Working Paper Series • Coupled Carbon Cycle Climate Model Intercomparison Project Friedlingstein et al., 2006
The Climate Model Intercomparison Project (CMIP) • There are different, highly complex global coupled atmosphere-ocean general circulation models (`climate models‘) • They provide different results over next decades and longer timescales • Intercomparisons necassary to discover why and where different models give different output or detect ‚consensus‘ aspects. • The World Climate Research Programme`s Working Group on Coupled Modelling (WGCM) proposed and developed CMIP (now in phase 5) CMIP5 will provide the basis for the next Intergovernmental Panel on Climate Change Assessment (AR5), which is scheduled for publication in 2013
Data management for the IPCC Assessment Report AR4 AR5 • Data Volume • 10s of terabytes (1012 bytes) • Downloads: ~500GB/day • Models • 25 models • Metadata • CF-1 + IPCC-specific • User Community • Thousands of users • WG1, domain knowledge • Data Volume • 1-10 petabytes (1015 bytes) • Downloads: 10s of TB/day • Models • ~35 models • Increased resolution • More experiments • Increased complexity (ex: biogeochemistry) • Metadata • CF-1 + IPCC-specific • Richer set of search criteria • Model configuration • Grid specification from CF (support for native grids) • User Community • 10s of thousands of users • Wider range of user groups will require better descriptions of data, attention to ease-of-use
An emerging world wide infrastructure for climate model data intercomparison • The scene: • CMIP5 / IPCC AR5 • ESG-CET (Earth System Grid – Center for enabling technologies) • IS-ENES and Metafor FP7 programs
The CMIP5 federated architecture: • Data nodes: • holding data from individual modeling groups • Gateways: • search, access services to data • oftenly co-allocated to (big) data nodes • roadmap: Curator+ESG in US, • Metafor+IS-ENES in Europe • Core Nodes: • providing CMIP5 defined CORE data (on rotating disks) • roadmap: several in US, • two in Europe (BADC, WDCC) and one in Japan US (PCMDI) GB (BADC) Gateways (Tier 1) DE (WDCC) Data Nodes IPCCCore DKRZ Federation is a virtual trust relationship among independent management domains that have their own set of services.Users authenticate once to gain access to data across multiple systems and organizations.
CMIP5: • > 20 modelling centres • > 50 numerical experiments • > 86 simulations (total ensemble members) within experiments • > 6500 years of simulation • > Data to be available from “core-nodes” and “modelling-nodes” in a global federation. • > Users need to find & download datasets, and discriminate between models, and between simulation characteristics. • CMIP5, IPCC-AR5, Timeline: • - Simulations Starting in mid-2009. • - Model and Simulation Documentation needed in 2009 (while models are running). • - Data available: end of 2010 • - Scientific Analysis, Paper Submission and Review: early to mid 2012 (current absolute deadline, July). • - Reports: early 2013!
An emerging world wide infrastructure for climate model data intercomparison • The scene: • CMIP5 / IPCC AR5 • ESG-CET (Earth System Grid – Center for enabling technologies)